Never try to sell at the top. It isn’t wise.
Sell after a reaction if there is no rally.
Jesse Livermore
On Investors.com IBDLive, Chris Gessel often uses @thinkorswim to highlight technical action. Chris has been using a regression line that is discussed by Mike Webster on his Weekly Stock Market Update.
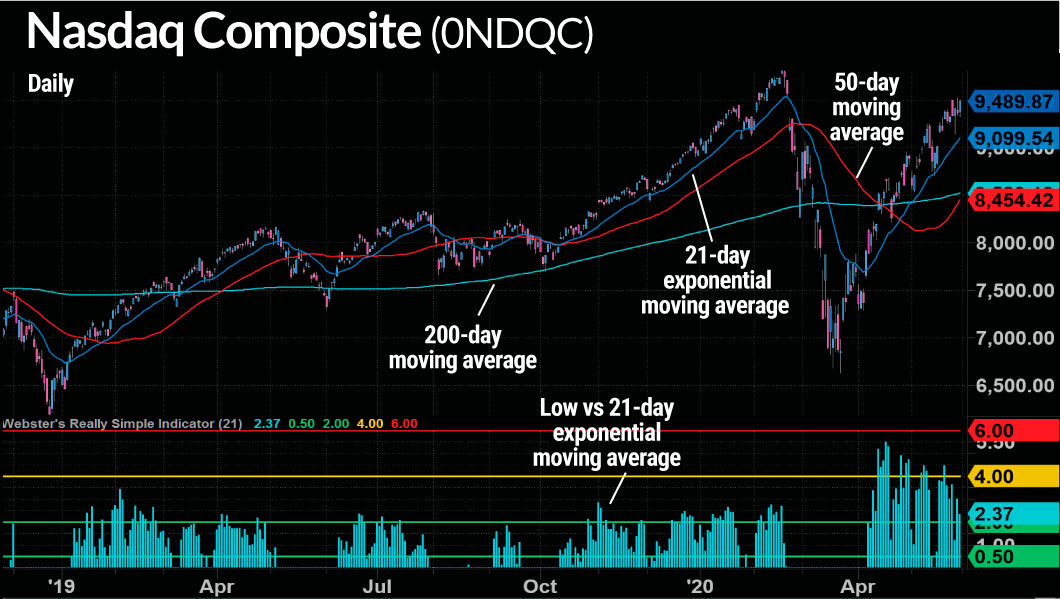
I’ve created a similar configuration that I thought others might find helpful. The image below shows the configuration that I describe in the steps that follow. Notice how the highs and lows of the Nasdaq Composite have held within the half standard deviations.
Mike Webster is the creator of Webby’s RSI (really simple indicator), a gauge on the health of an uptrend. Mike discusses the RSI each week in IBD’s Weekend Stock Market Update. You can read more about the RSI here.
An example of Webby’s RSI (bottom third of the chart):
Mike Webster and Irusha Peiris recently discussed power trends on the Investing with IBD Podcast. Ajay Jani took the time to code the concept in an Excel document which shows power trends for both the Nasdaq and S&P.
The orange indicator in the charts that follow, highlights where the power trend is on. The Nasdaq chart goes back to 1984 and the S&P 500 back to 1962. Richard Moglen helped Ajay with data acquisition.
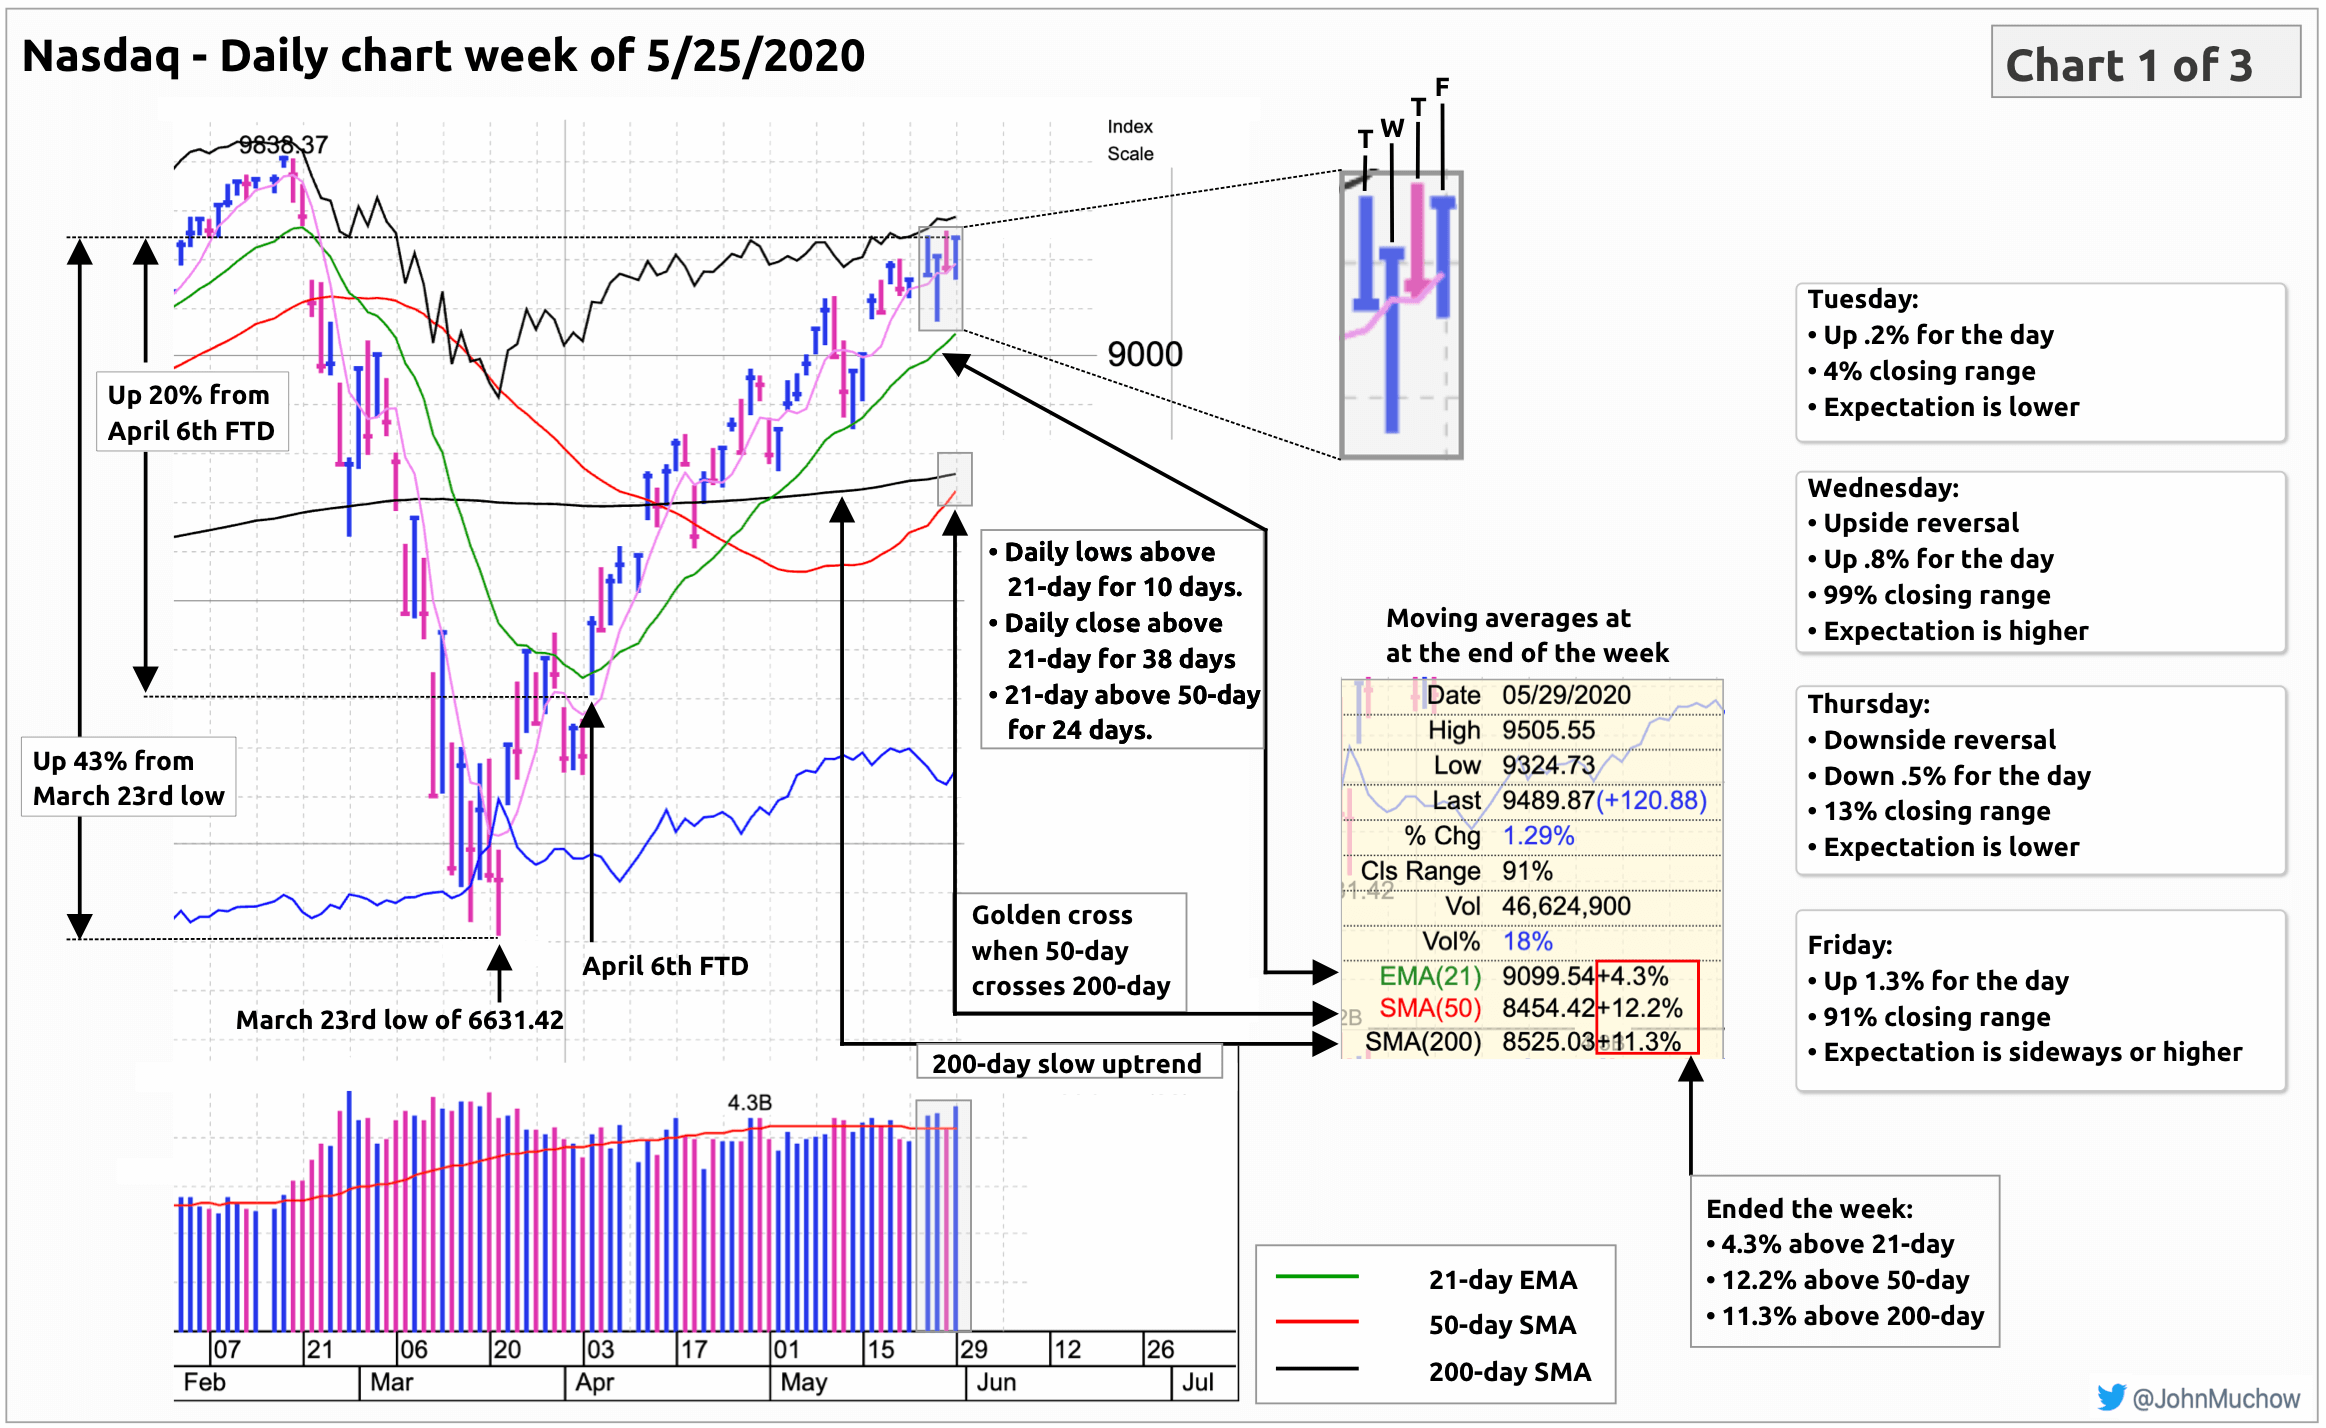
Continue readingThe following three charts are based on @mwebster1971‘s Weekend Stock Market Update, The Raging Bull Rests.
The first chart focuses on the daily activity as well as a summary of the moving averages at the close of the week.
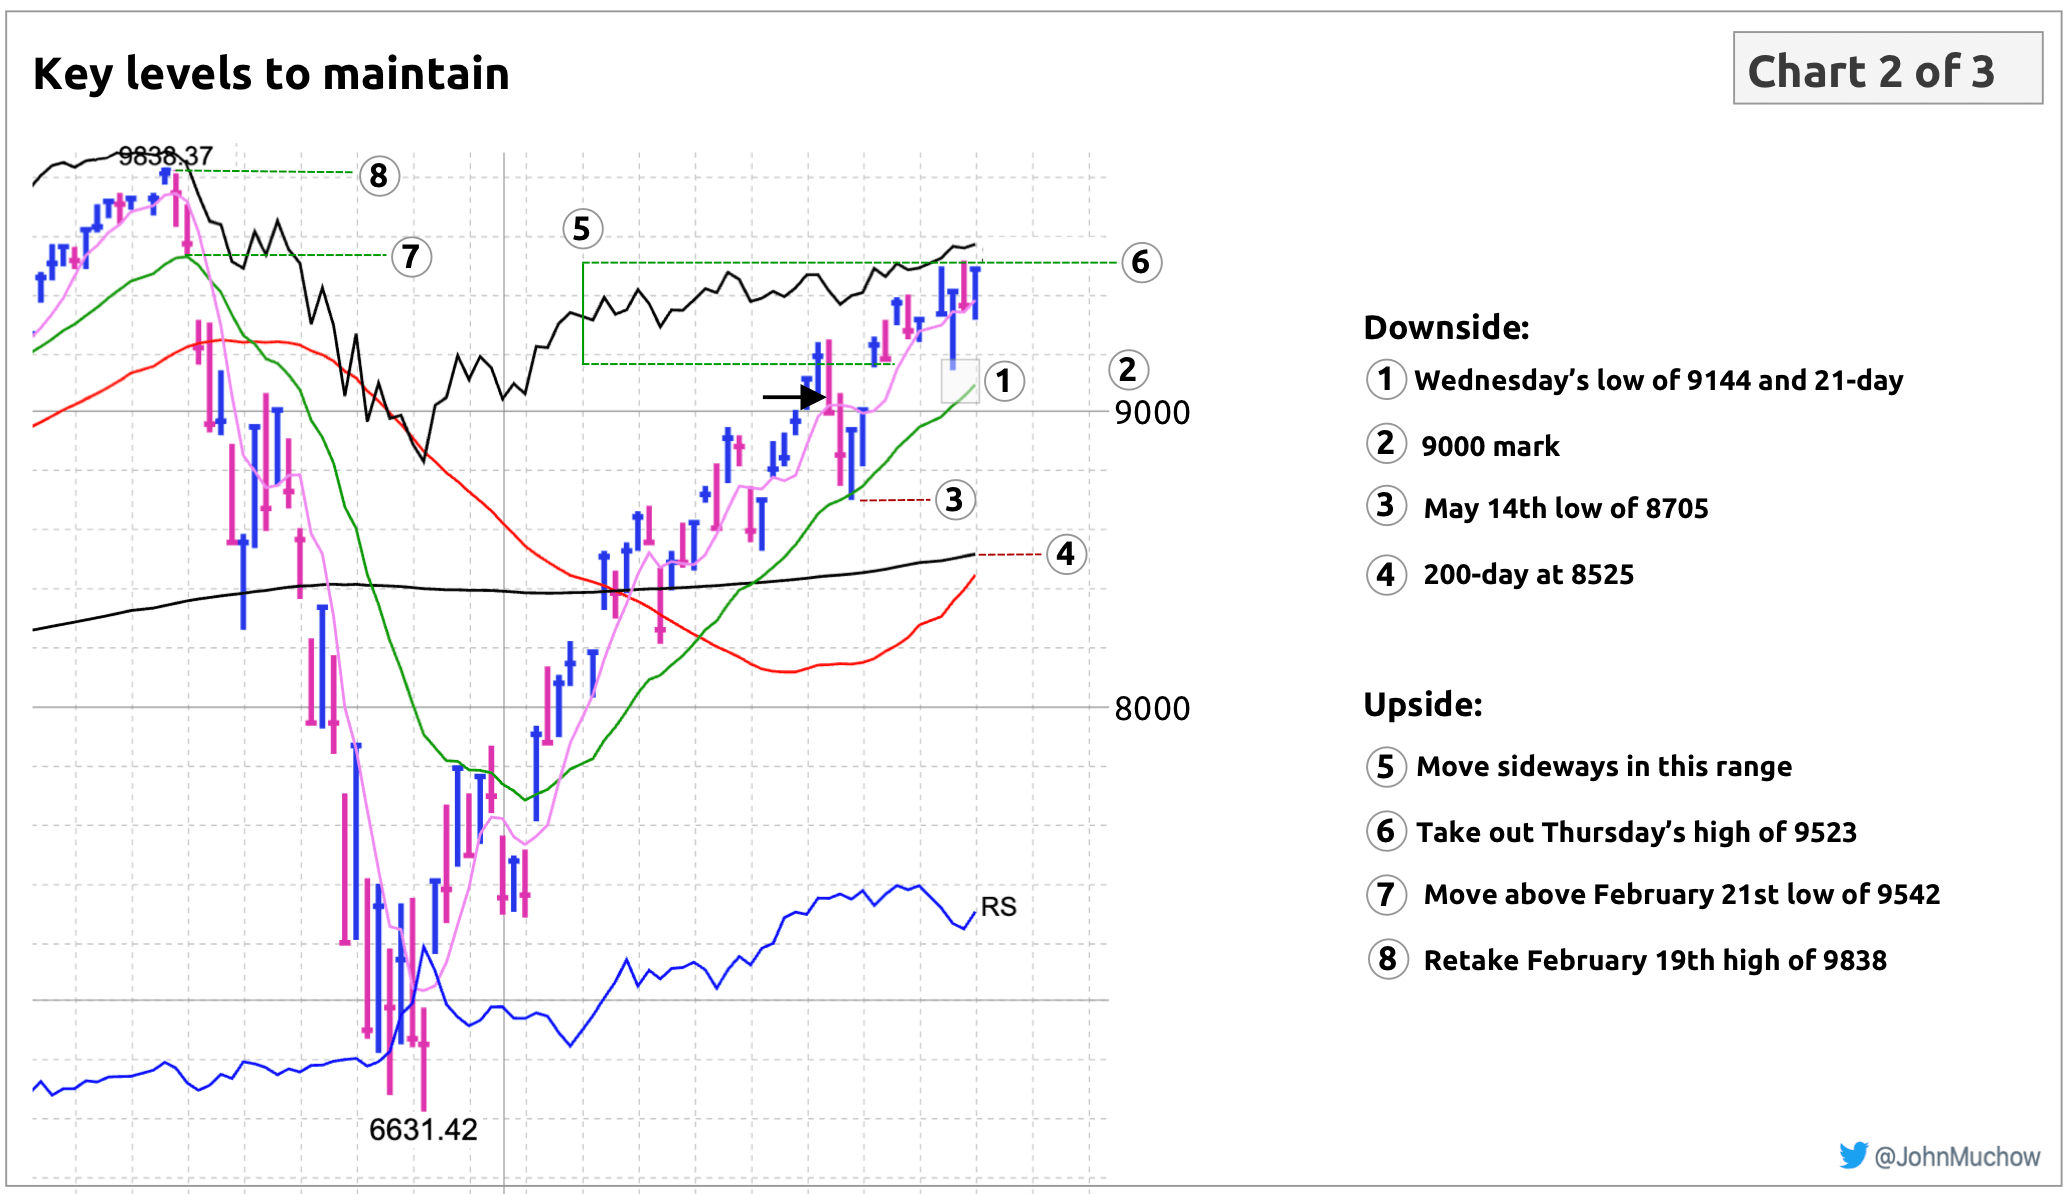
As we move into next week, there are key levels to maintain both on the upside and downside.
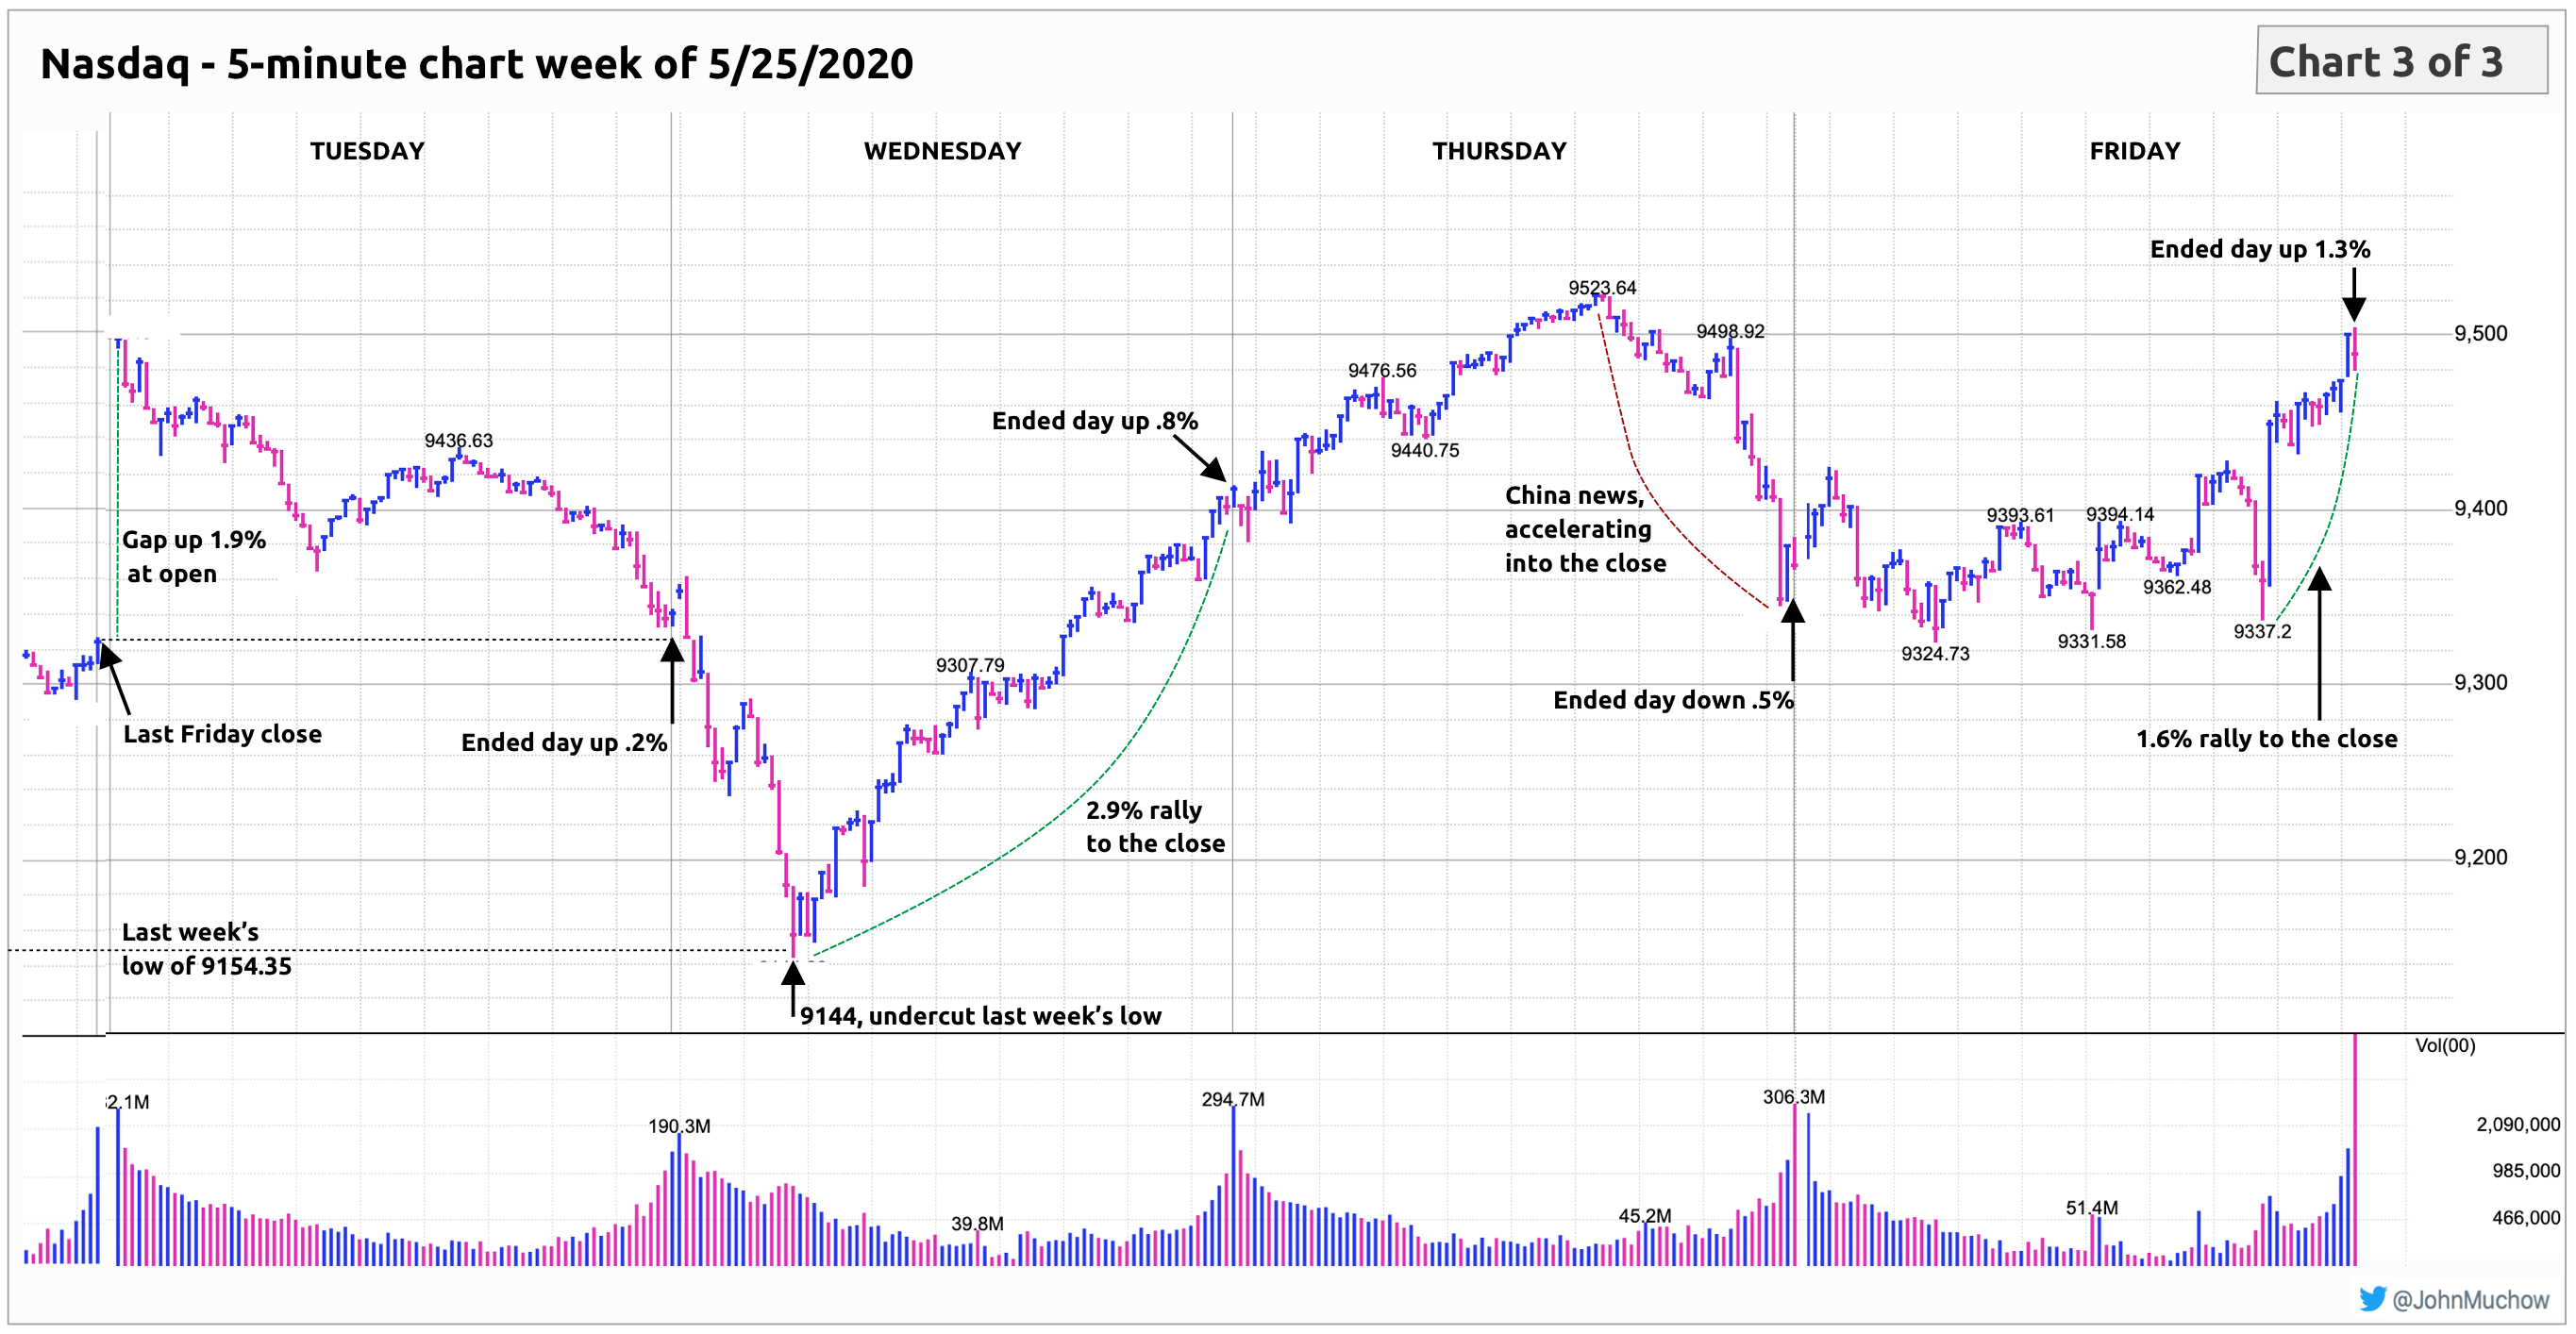
It’s always good to see the view from 30,000 feet. The 5-minute chart that follows provides that perspective.
Given we started a power trend on 5/8/2020, the topic has been a common theme of @mwebster1971‘s Weekend Stock Market Update.
In a previous post, What is a Power Trend and How to Spot it on a Chart, I outlined the specifics needed to start a power trend. I also included examples of two power trends, one in 2016 and one in 2018.
Continue readingFollowing are three charts that you can use as a visual reference for @mwebster1971‘s Weekend Stock Market Update for the week of 5/18/2020.
The first chart shows the 30,000 foot view of the week’s activity. I’ve highlighted the chart with colors to emulate a candlestick look on top of a 5-minute chart.
Continue readingI recently used a pullback followed by an upside reversal to buy shares in two stocks. One of the buys was within a base, which I used as an early entry. The second was a buy to add to an existing position.
It’s worth noting, I am not recommending either stock. My intention is to show how I used a pullback and reversal for two past trades.
Continue readingOnline treasures
- Siti Scommesse Non Aams
- Casino En Ligne
- Non Gamstop Casinos
- UK Casinos Not On Gamstop
- Non Gamstop Casinos
- Casino Not On Gamstop
- Best Non Gamstop Casinos
- Gambling Sites Not On Gamstop
- UK Online Casinos Not On Gamstop
- Casino Sites Not On Gamstop
- Non Gamstop Casinos
- Slots Not On Gamstop
- Gambling Sites Not On Gamstop
- Best Casino Sites Not On Gamstop 2025
- Casino Online Non Aams
- Casino Not On Gamstop
- Casinos Not On Gamstop
- Casino En Ligne
- Non Gamstop Casinos
- UK Casino Not On Gamstop
- Top UK Slot Sites
- Casino Sites Not On Gamstop
- Best UK Casinos Online
- Meilleur Casino En Ligne
- Casinos Not On Gamstop
- Casino Online Italia
- Site Paris Sportif Belgique
- Meilleur Site Casino En Ligne Belgique
- Meilleur Site De Casino En Ligne Belgique
- Siti Scommesse
- Paris Sportif Ufc
- 日本 ブック メーカー
- Casino Non Aams Recensioni
- Top Casino En Ligne
- Siti Non Aams Sicuri
- Casino En Ligne France
- Casino En Ligne
- Casino En Ligne France
- Casino En Ligne Argent Réel France
- Casino En Ligne France
© 2020 PlayTheTrade.com