


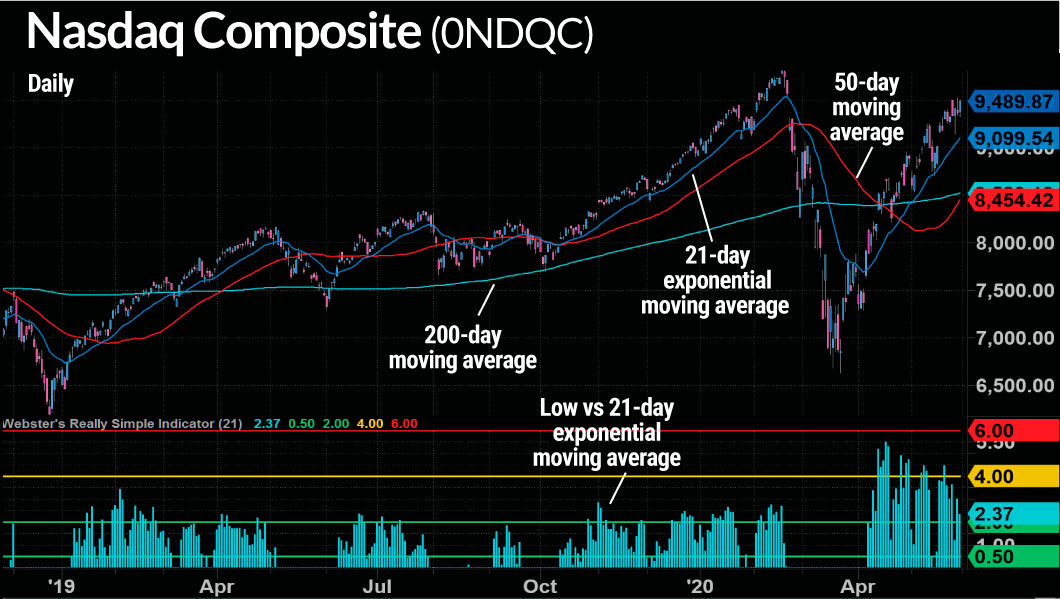
Mike Webster is the creator of Webby’s RSI (really simple indicator), a gauge on the health of an uptrend. Mike previously discussed the RSI in IBD’s Weekend Stock Market Update. You can read more about the RSI here.
Mike wrote the indictor in EasyLanguage for the TradeStation platform. Here’s how Webby’s RSI (bottom third of the chart) looks in TradeStation:
Installing Webby’s RSI in thinkorswim
I ported Mike’s original code to thinkscript, which you can install directly from the thinkorswim Sharing Center. If you have thinkorswim installed, click here to install the study.
As another option, you can copy/paste the link into thinkorswim Open Shared Item from within thinkorswim, the link is: https://tos.mx/7Ugk2Wi
Important note: unfortunately, thinkscript is only available on the desktop version of thinkorswim.
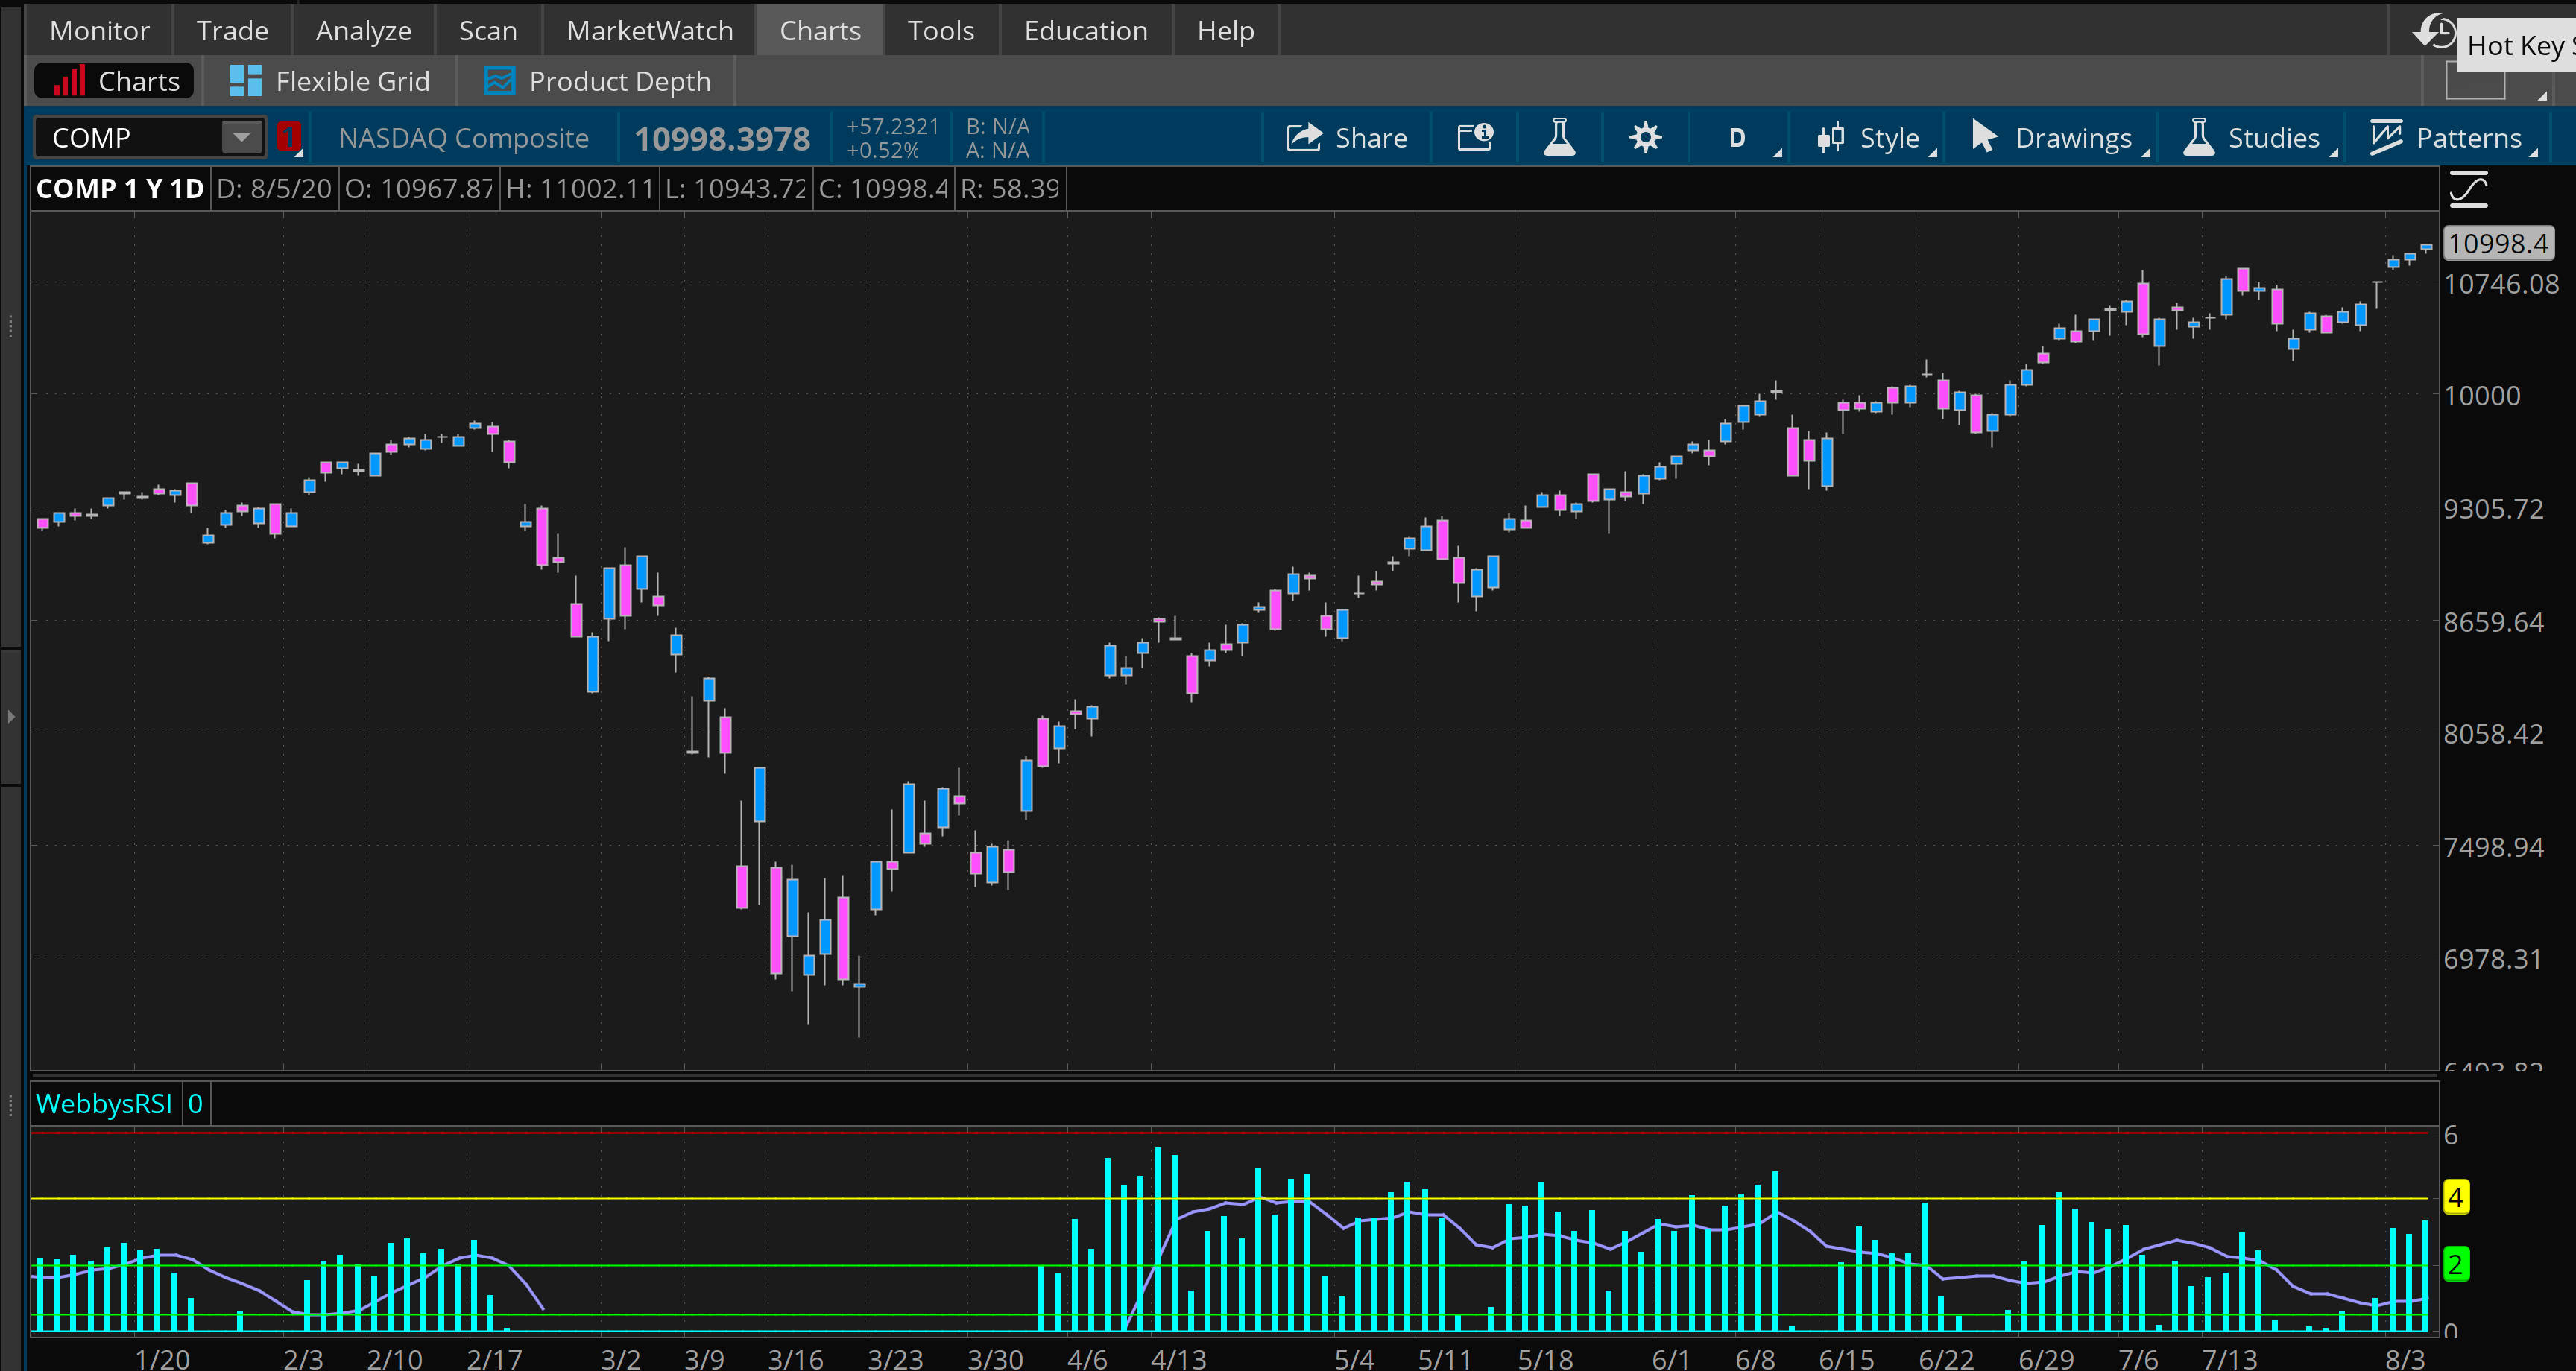
Here’s how the thinkScript version of Webby’s RSI looks in thinkorswim:
thinkscript Code
If you prefer to create your own script in TOS and copy/paste the code, the script in its entirety is shown below. If you use the code in your own study, it would be appreciated if you keep the header comment with the links intact.
# Webby's RSI (Really Simple Indicator)
# Plot percentage of the day's low vs 21-day EMA.
#
# More details on Webby's RSI
# https://www.investors.com/market-trend/stock-market-update-raging-bull-rests/
#
# Webby's RSI is featured each week in IBD's Weekend Stock Market Update
# https://www.investors.com/tag/weekend-stock-market-update/
#
# Webby's RSI was written by Mike Webster in EasyLanguage for TradeStation
# Follow Mike on Twitter: @mwebster1971 http://twitter.com/mwebster1971
#
# Ported to ThinkScript by John Muchow
# Follow John on Twitter: @JohnMuchow http://twitter.com/JohnMuchow
# Web: https://PlayTheTrade.com
#----------------------------------------------------------
# Setup
#----------------------------------------------------------
# Show data in lower window
declare lower;
# Calculate 21-day EMA of close
def _21DayExpMovingAverage = ExpAverage(close, 21);
# Webby RSI data point - percent of day's low vs 21-day EMA
def lowVs21DayMovingAverage = (((low - _21DayExpMovingAverage) / close) * 100);
# Calculate simple moving average of data points over 10 days
def _10DayMovingAverage = Average(lowVs21DayMovingAverage, 10);
#----------------------------------------------------------
# Show lines on graph at various intervals
#----------------------------------------------------------
plot _0Line = 0;
_0Line.HideTitle();
plot _pt5Line = .5;
_pt5Line.setDefaultColor(Color.GREEN);
_pt5Line.HideTitle();
plot _2line = 2;
_2line.setDefaultColor(Color.GREEN);
_2line.HideTitle();
plot _4line = 4;
_4line.setDefaultColor(Color.YELLOW);
_4line.HideTitle();
plot _6Line = 6;
_6Line.setDefaultColor(Color.RED);
_6line.HideTitle();
#----------------------------------------------------------
# Plot histogram for Webby RSI, ignoring negative values
#----------------------------------------------------------
def isPointNegative = Sign(lowVs21DayMovingAverage) == -1;
plot histogram = if !isPointNegative then AbsValue(lowVs21DayMovingAverage) else double.nan;
histogram.SetPaintingStrategy(PaintingStrategy.HISTOGRAM);
histogram.setDefaultColor(Color.CYAN);
#----------------------------------------------------------
# Plot line showing moving average across the histogram
#----------------------------------------------------------
def isMovingAveragePointNegative = Sign(_10DayMovingAverage) == -1;
plot line = if !isMovingAveragePointNegative then AbsValue(_10DayMovingAverage) else double.nan;
line.setDefaultColor(Color.VIOLET);
line.setLineWeight(2);
August 6, 2020 at 9:04 am
This is amazing. Thank u so much for your hard work and commitment.
August 21, 2020 at 10:12 pm
Thank you it looks great. Thank you for all that you do for all of us .
August 23, 2020 at 11:22 am
That’s awesome John - a big thank you!
August 23, 2020 at 7:09 pm
Thanks a lot. Can Webby’s RSI be used on individual stocks.
August 23, 2020 at 8:28 pm
I would imagine so, yet there are probably some changes needed. If I figure that out, I’ll post an update.
August 25, 2020 at 8:00 pm
I figured out that if you comment out plot line 4 and 6 it auto scales for a better UX.
August 25, 2020 at 8:03 pm
Thanks, I’ll give it that a try.
August 28, 2020 at 2:14 pm
Deaconbluegrass, I’m not a “programmer”, so I’m not sure how to “comment out” the plot lines. Could you re-post the code with your changes so I’ll be able to copy and past into TOS. Or just email to me. Thanks a lot!
September 1, 2020 at 8:05 am
Gary, you can comment out code in thinkscript using a “#” sign at the start of the line.
August 28, 2020 at 4:53 pm
BAM!
September 1, 2020 at 12:11 am
John… Thanks so much… I had TOS late night shift help me… Looks great… Any other ideas, thoughts or suggestions would be great… Big supporter of IBD-Live…
September 1, 2020 at 8:04 am
I hope you find it helpful, Terry. I agree, #IBDLive is awesome.
September 7, 2020 at 10:19 am
Thanks for the script.
September 7, 2020 at 9:25 pm
Thanks John, this is fantastic!
October 28, 2020 at 7:54 am
Thanks John. Just curious if this indicator can help us to find the start of an uptrend? If so, how can we scan for it? Thanks
October 28, 2020 at 8:18 am
Nick, there is a brief discussion about how to interpret the RSI here, including mention of high values at the beginning of a bull market.
January 10, 2021 at 2:42 pm
This is great. Does anyone know how to get IBD’s Relative Strength Line into TOS? I added and RSI study but the line does not match how IBD calculates it.
January 10, 2021 at 3:20 pm
The implementation as shown is what IBD is using. What doesn’t seem to match?