MonthMarch 2020

Stock Market Update Charts - Week of 03/16/20

Stock Market Update: Fear, Volatility and George Costanza?, written by Mike Webster, was published today on Investor’s Business Daily. This weekly article is an excellent overview of the technical action for the past week.

I’ve created a summary of the article in the chart below:
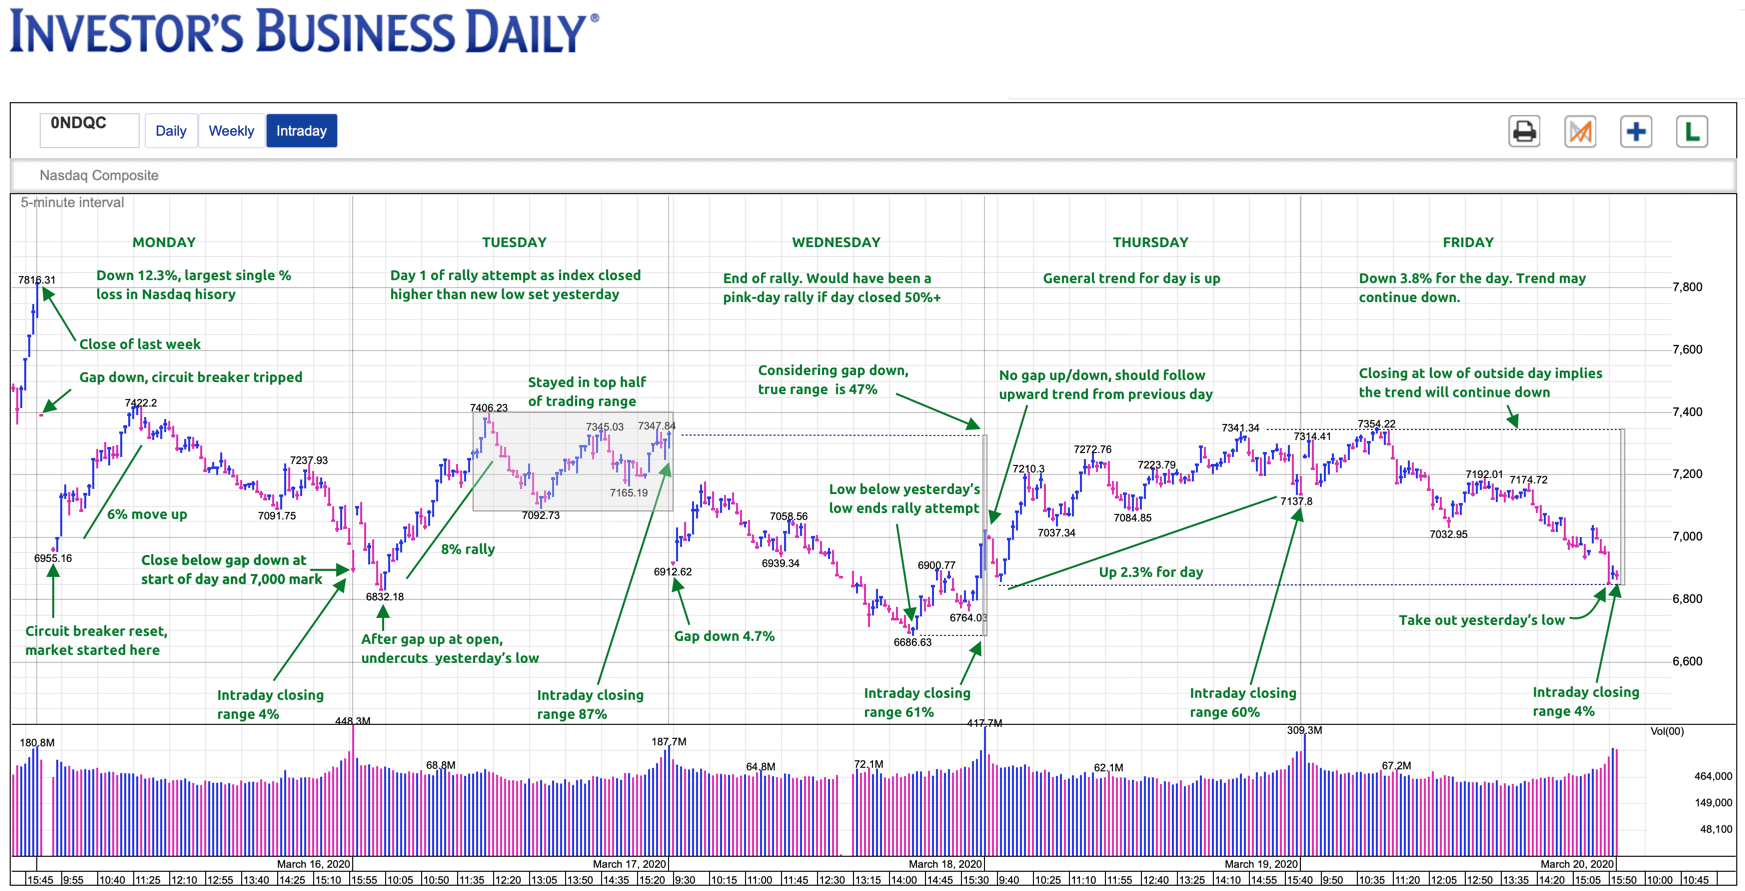
Webby’s Knockin’ On Heaven’s Door Screen

It’s always darkest before… “Knockin’ On Heaven’s Door” Screen

I think you know what time it is, watchlist time. @IBDinvestors@MarketSmith

Continue reading

Understanding Earnings Stability & EPS Growth Rate

Earning stability is an indicator of the predictability of a companies earnings. Another way to think of it is a volatility ranking of the earnings. The lower the number, the less volatile. Anything under 10 is very stable. For example, an earning stability of 3 indicates a company has consist earnings, quarter to quarter, year over year.

As far as the EPS growth rate, the technical definition follows:

The compound 3-year growth rate calculated using the least squares fit over the latest two to three years’ earnings per share on a running 12-month basis.

Investors.com
Continue reading

Webby’s K.I.S.S. Screen

Keep it simple…RS Line at new highs! “Webby’s K.I.S.S.” screen.

I suggest running this daily & merge results into a list.

When we have an FTD (follow through day), regardless if it’s a couple days from now or a couple months, that will be a great pond to fish in. @IBDinvestors @MarketSmith

Continue reading