Yes, I am addicted to custom screens. I’ll stop soon 😂
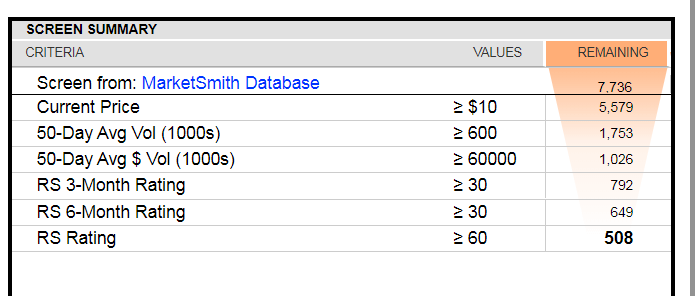
Search for the next winner here! Webby’s Texas Flood @MarketSmith screen.
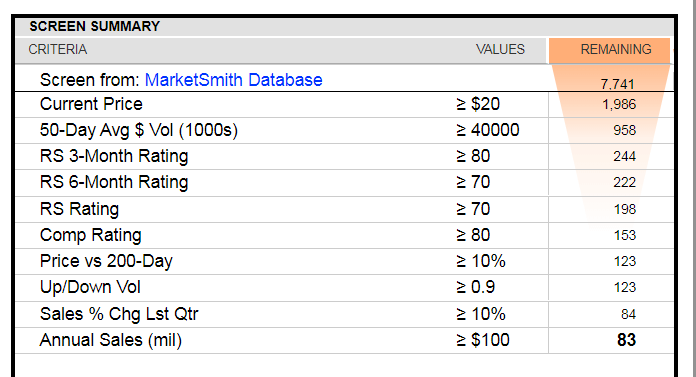
Yes, I created that screen so I could send this guilt free 😂😂
Continue reading
Yes, I am addicted to custom screens. I’ll stop soon 😂
Search for the next winner here! Webby’s Texas Flood @MarketSmith screen.
Yes, I created that screen so I could send this guilt free 😂😂
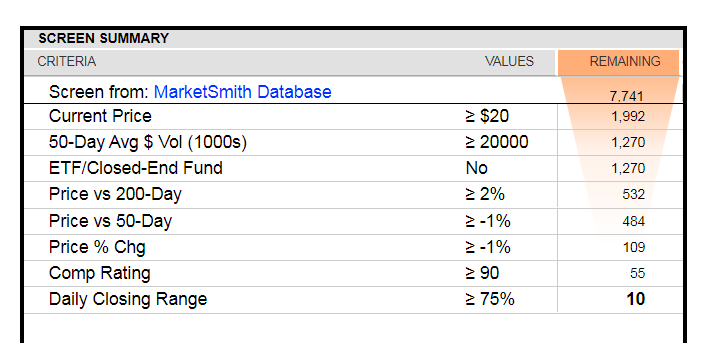
Continue readingScreening on down days in the market is very helpful. Focus on stocks that are down less than the market AND have high closing ranges.
Webby’s Tell @MarketSmith screen. @IBDinvestors
Following are three charts based on @mwebster1971‘s stock market update The Raging Bull Battle. Hopefully these will provide some additional visual context to the week’s technical action.
I’ve been asked for my @IBDinvestors SWINGTrader Watch List. Here you go… Webby’s ST Universe @MarketSmith screen.
© 2021 PlayTheTrade.com