Indicators

Technical indicators I’ve published for the TradingView platform.

Position Size Calculator for thinkscript

A position size calculator can help you focus on fundamental and technical analysis without getting bogged down in repetitive tasks such as determining the number of shares to buy and the resulting position size. Let me explain.

Before I enter a trade, there are a few things I always know up front: how much I am willing to risk as a percent of my equity, where my original stop will be set, and my first target to consider taking profit (full or partial).

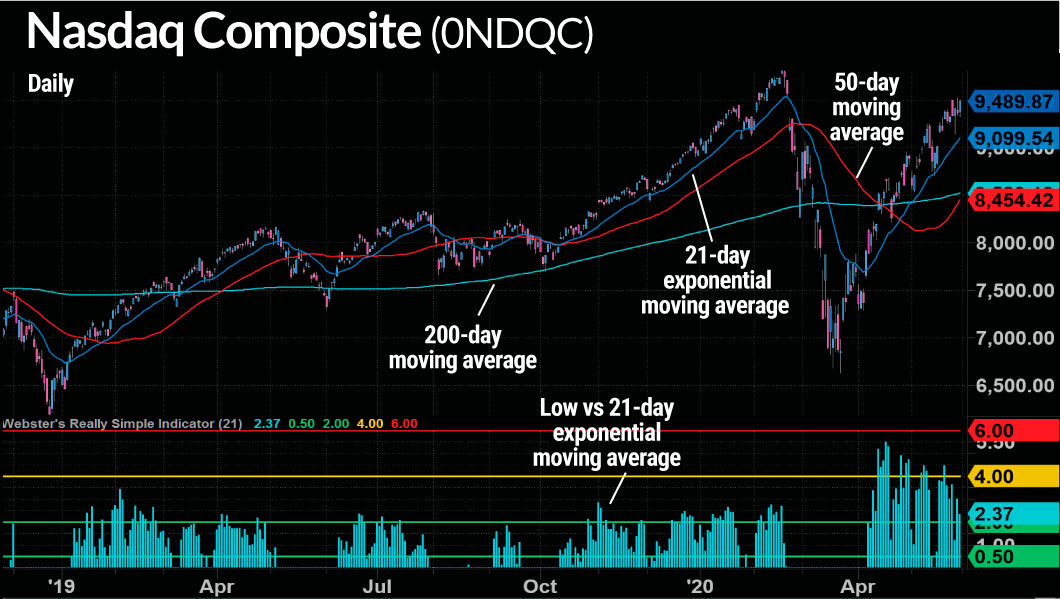
As far as a stop, based on my research of previous chart patterns as well as my own trades, I often find that a break of a moving average is a good place to consider a stop.

Continue reading

Quarterly EPS Shown as a Line Graph in thinkscript

One aspect I really appreciate of charting apps that offer custom coding capabilities is that you can present information visually that typically is not shown in that manner. For example with a few lines of thinkscript code you can plot a line graph of quarterly EPS in thinkorswim.

What follows is a screenshot of the line graph I wrote in less than 30 lines of code. The red and green dots represent the quarterly earnings, indicating if the current results were up/down from the previous report. I also appended at the bottom of the image the optional EPS bubble.

Continue reading

Webby’s RSI in thinkscript

Mike Webster is the creator of Webby’s RSI (really simple indicator), a gauge on the health of an uptrend. Mike previously discussed the RSI in IBD’s Weekend Stock Market Update. You can read more about the RSI here.

Mike wrote the indictor in EasyLanguage for the TradeStation platform. Here’s how Webby’s RSI (bottom third of the chart) looks in TradeStation:

Continue reading