


When a Power Trend is active, there is a stronger than usual uptrend underway. The concept of a Power Trend was defined by Investor’s Business Daily, more specifically, their Market School course designed to mimic the trading style of IBD’s Founder, William O’Neil.
The specifics of a Power Trend were defined by Mike Webster, Justin Nielsen and Charles Harris, while working with William O’Neil at IBD. The uptrends of the Nasdaq Composite were studied in great detail, looking for characteristics that were similar across significant uptrends. The end result was a set of rules that define when a Power Trend starts and ends.
Knowing that there is a Power Trend in play can be helpful to gauge how aggressive to be with your trades.
The price action in a major index, such as the Nasdaq Composite, is the source for determining a Power Trend’s status. Using an index is based on the definition of a Power Trend from Market School. With this indicator, in addition to indexes, it will allow an ETF (more specifically, a “fund” as defined by TradingView) to be used as the source. The reason for the latter is that various ETFs such as ARKK, which are focused on “disruptive technology,” can be helpful to track trends for growth traders.
Get It!Free TradingView Indicators
If you’re interested to learn more about my work with TradingView, I’ve published 12 indicators that are are free to install and use. Check out all my TradingView indicators.
What Starts a Power Trend?
■ Low is above the 21-day EMA for at least 10 days.
■ 21-day EMA is above the 50-day SMA for at least five days.
■ 50-day SMA is in an uptrend.
■ Closes up for the day.
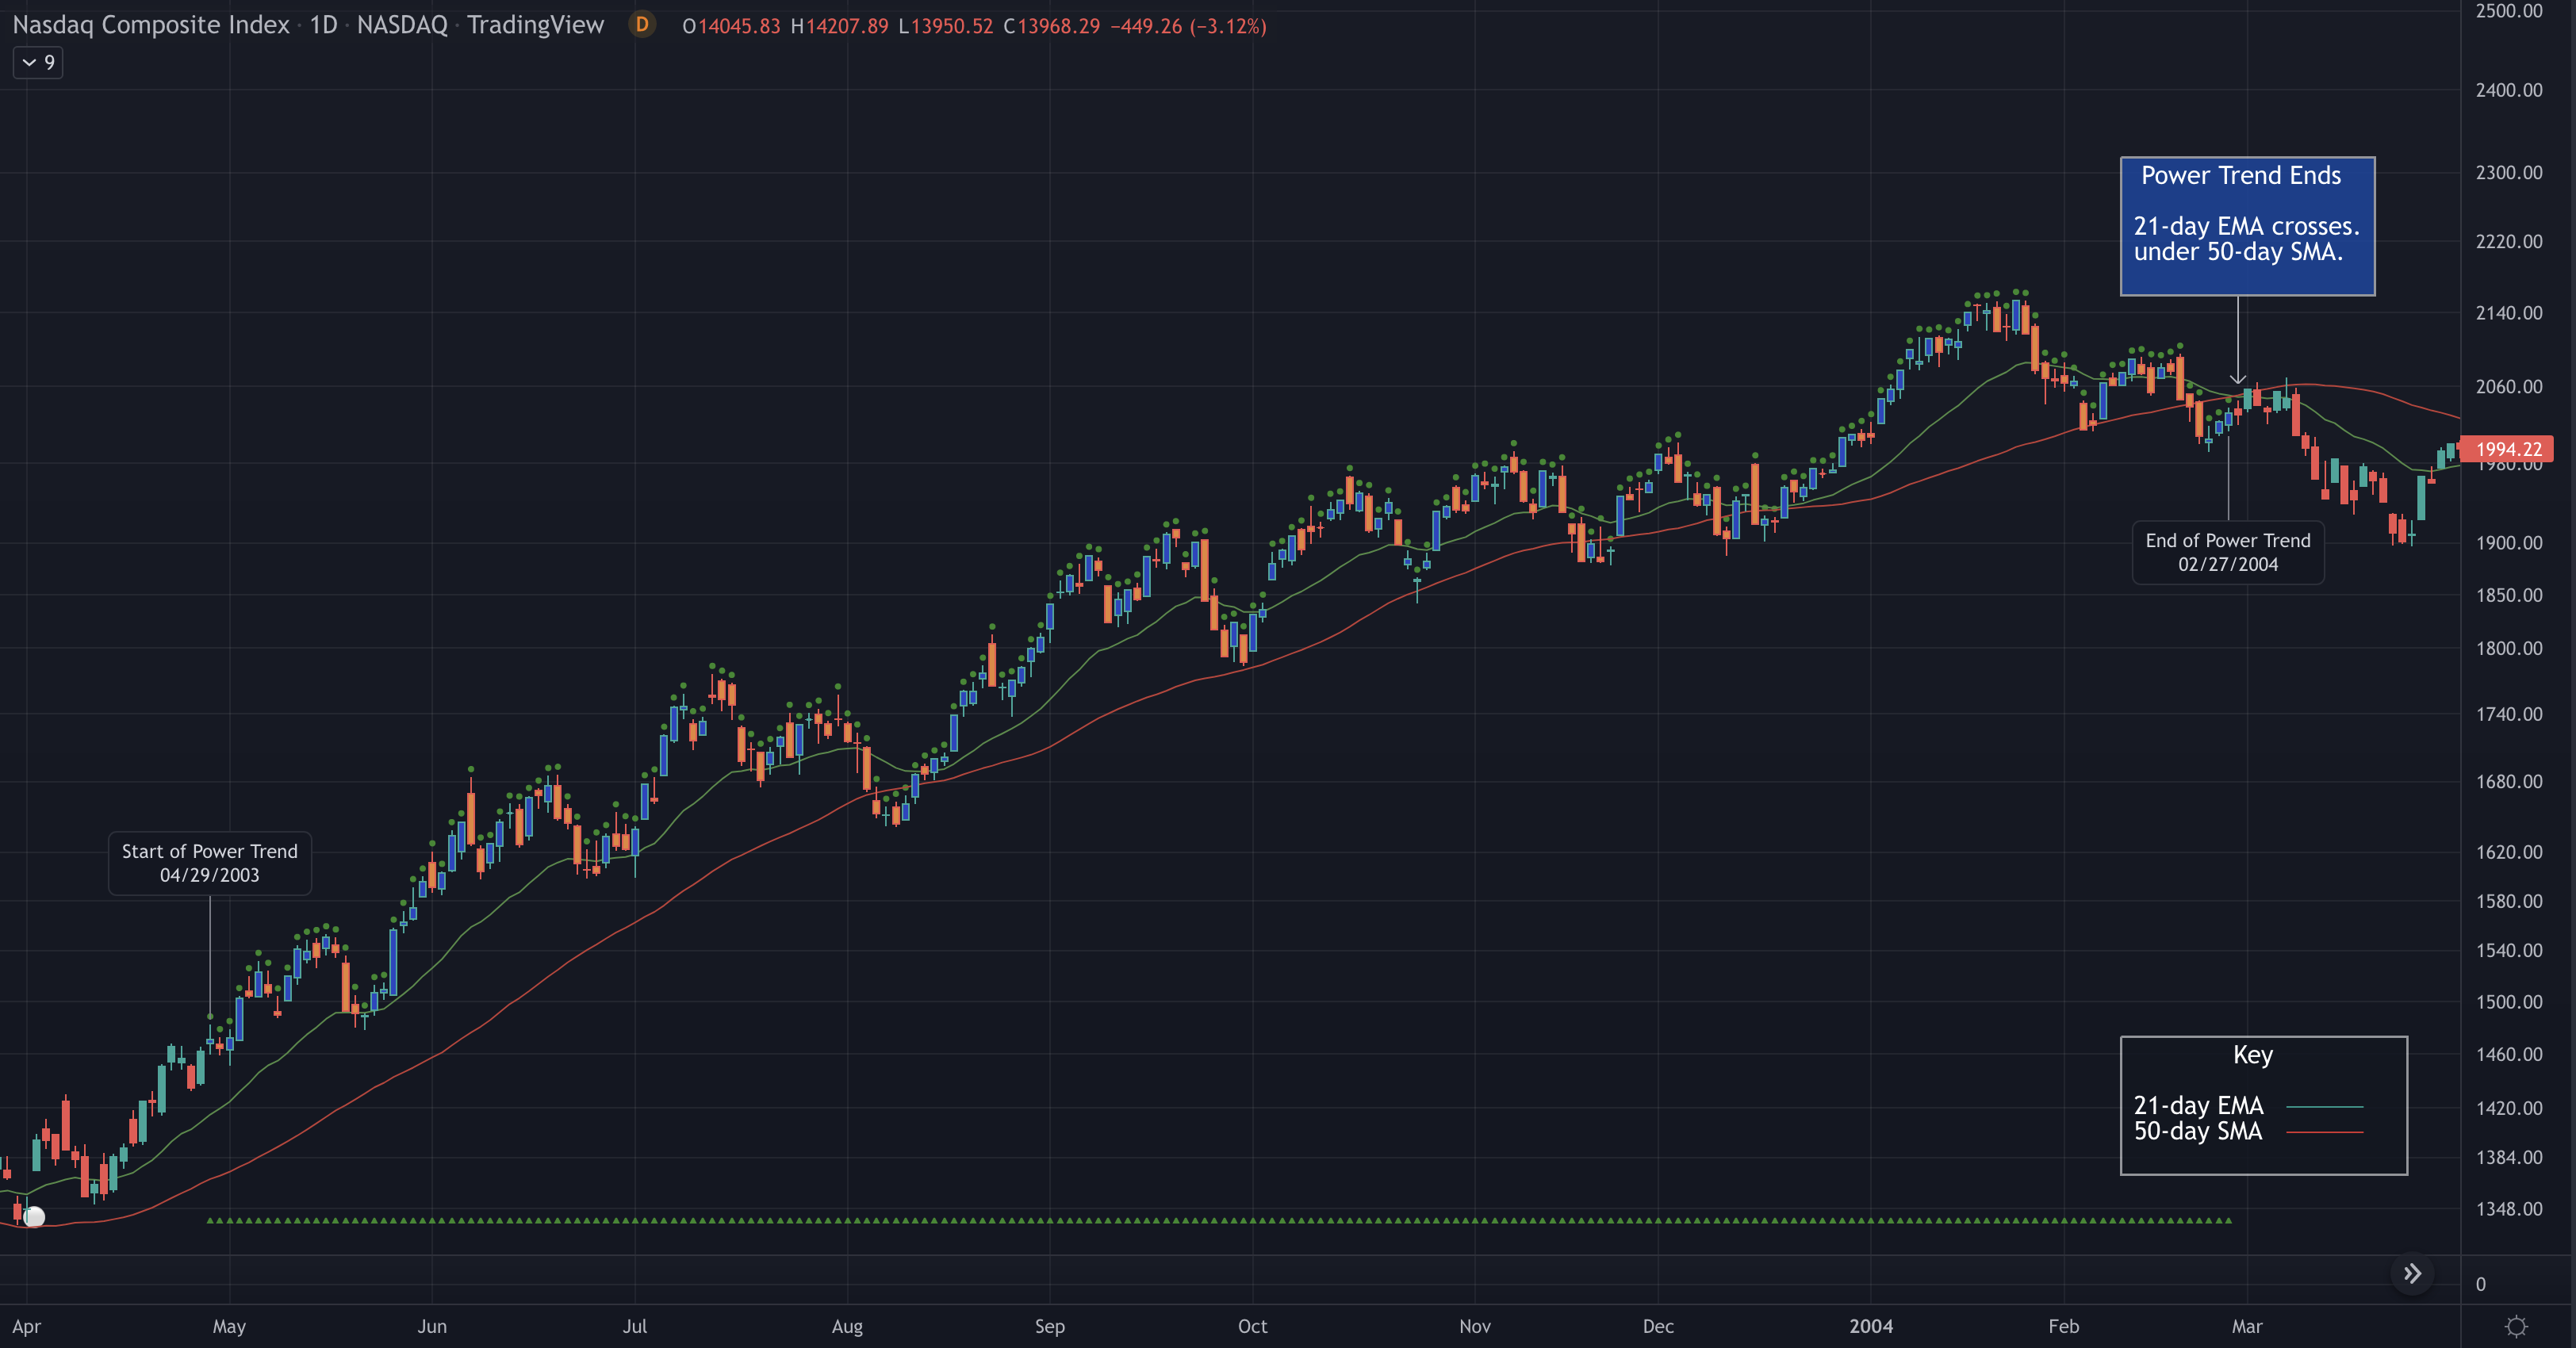
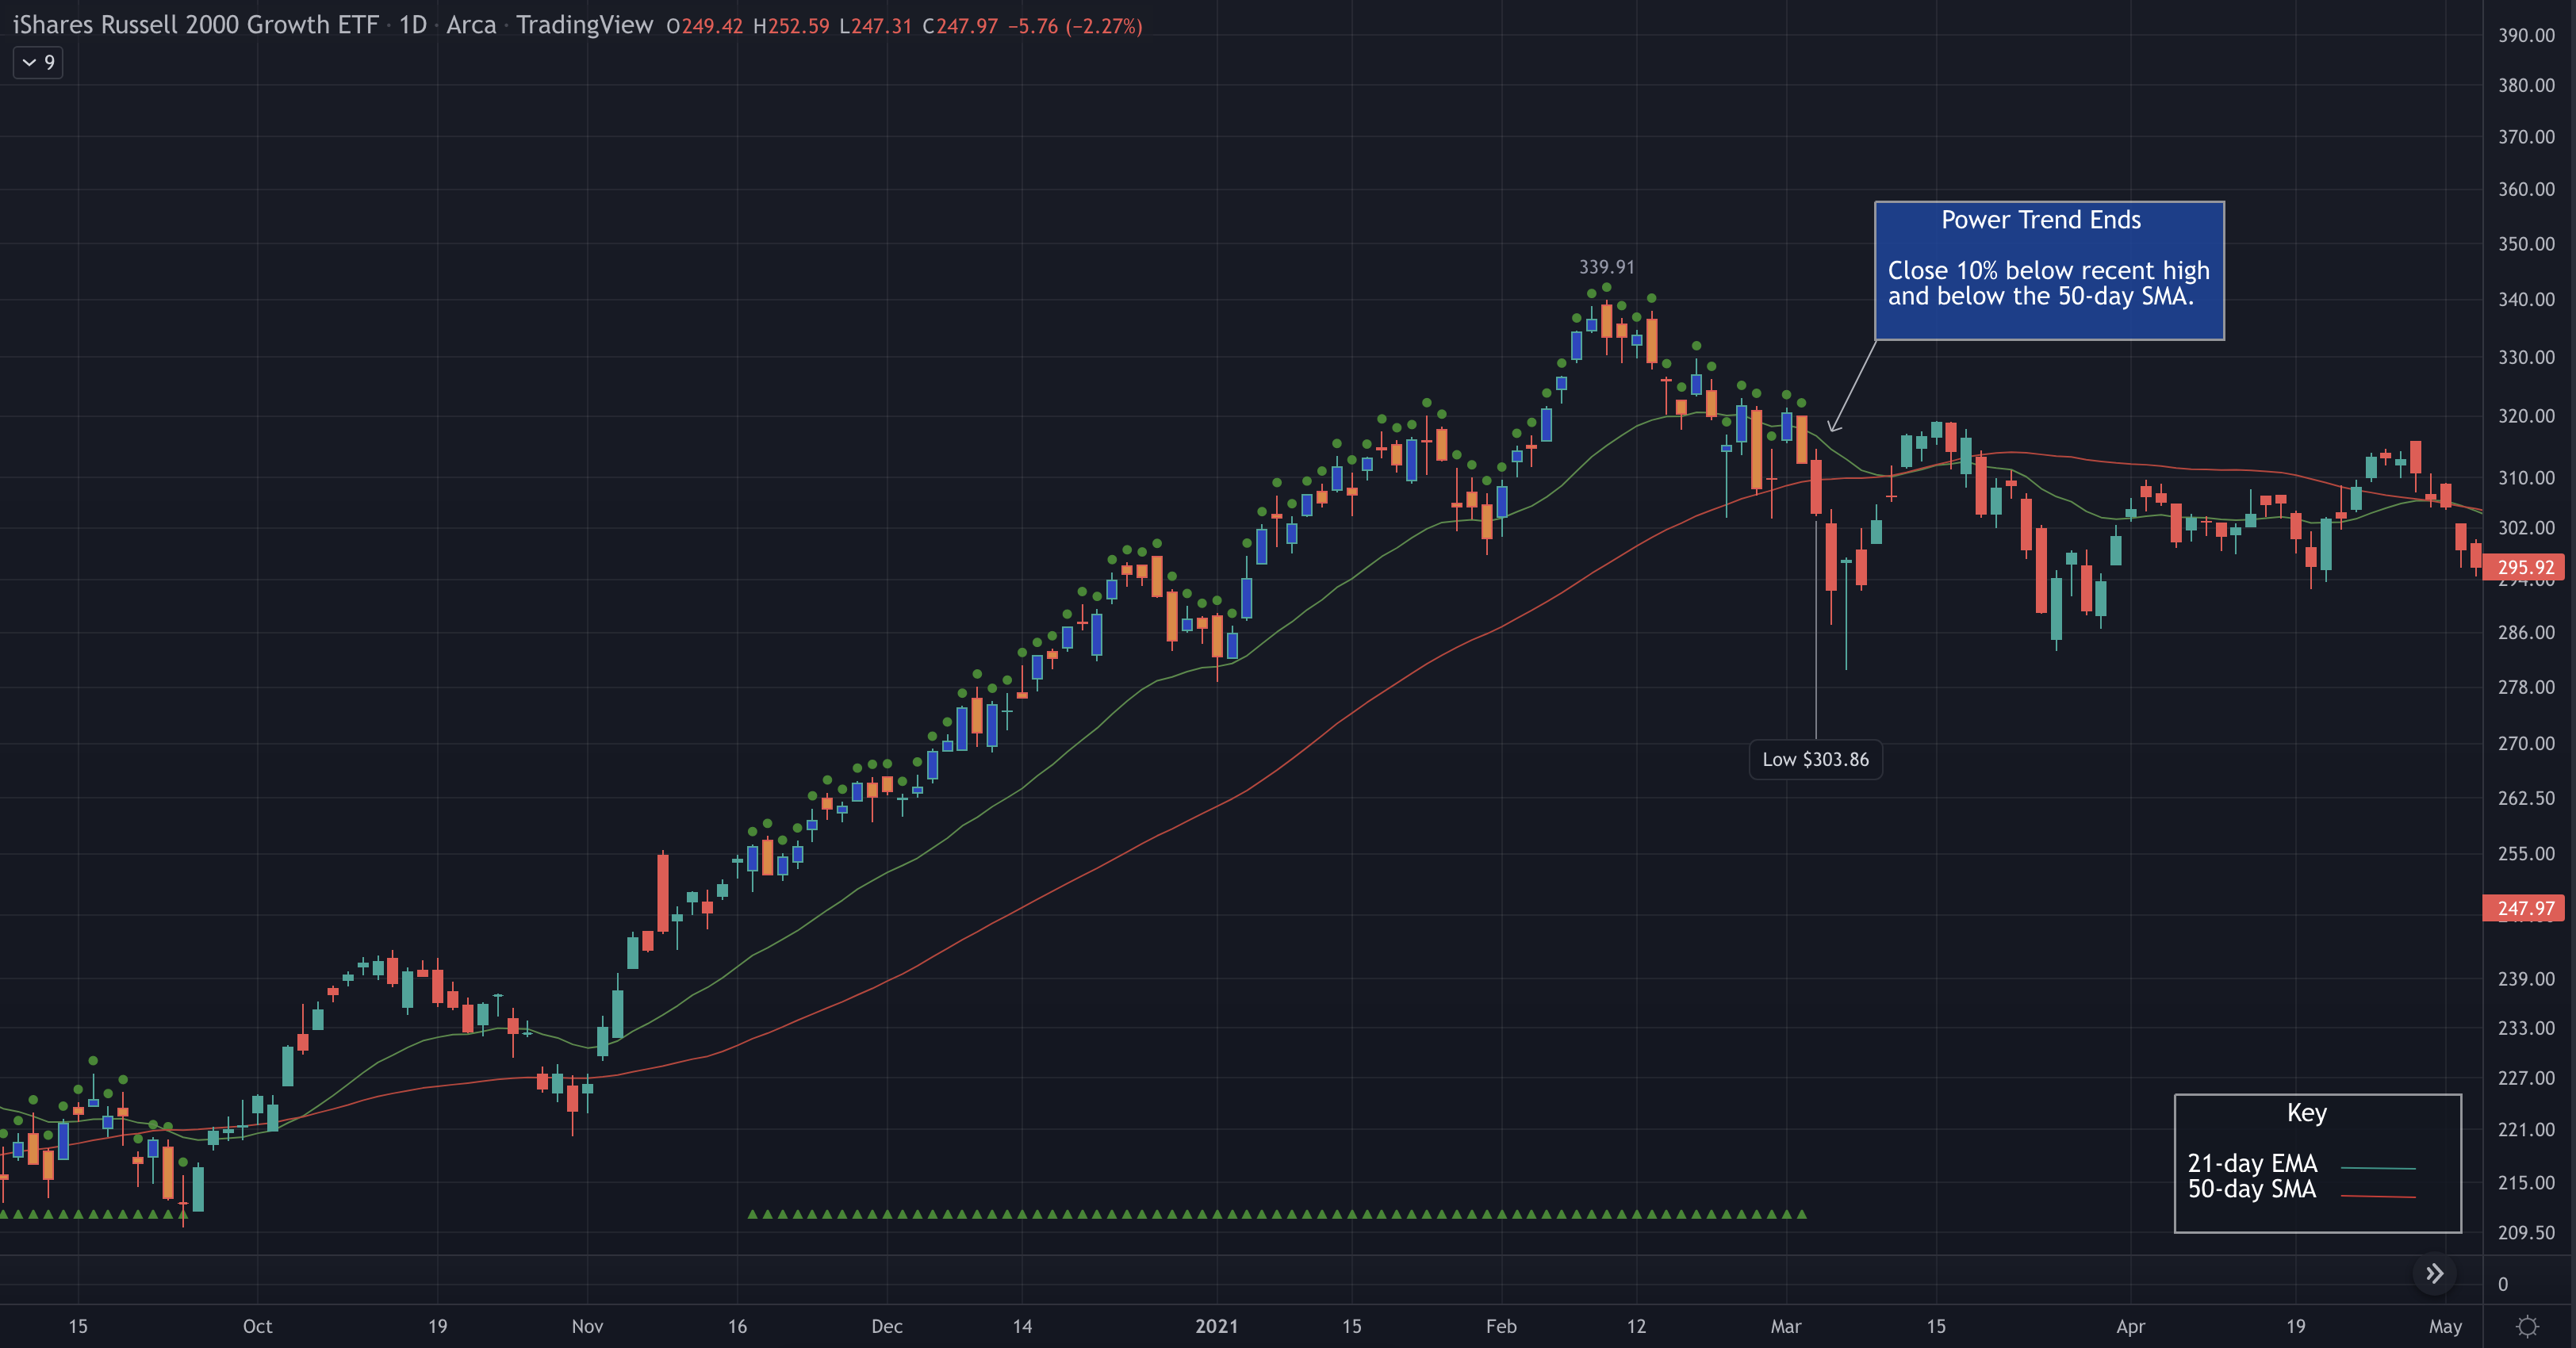
What Ends a Power Trend?
■ 21-day EMA crosses under 50-day SMA.
■ Close 10% below recent high and below the 50-day SMA.
Show Power Trend Status
With this indicator there are four unique ways to highlight Power Trends on a chart, each is shown in the chart that follows:
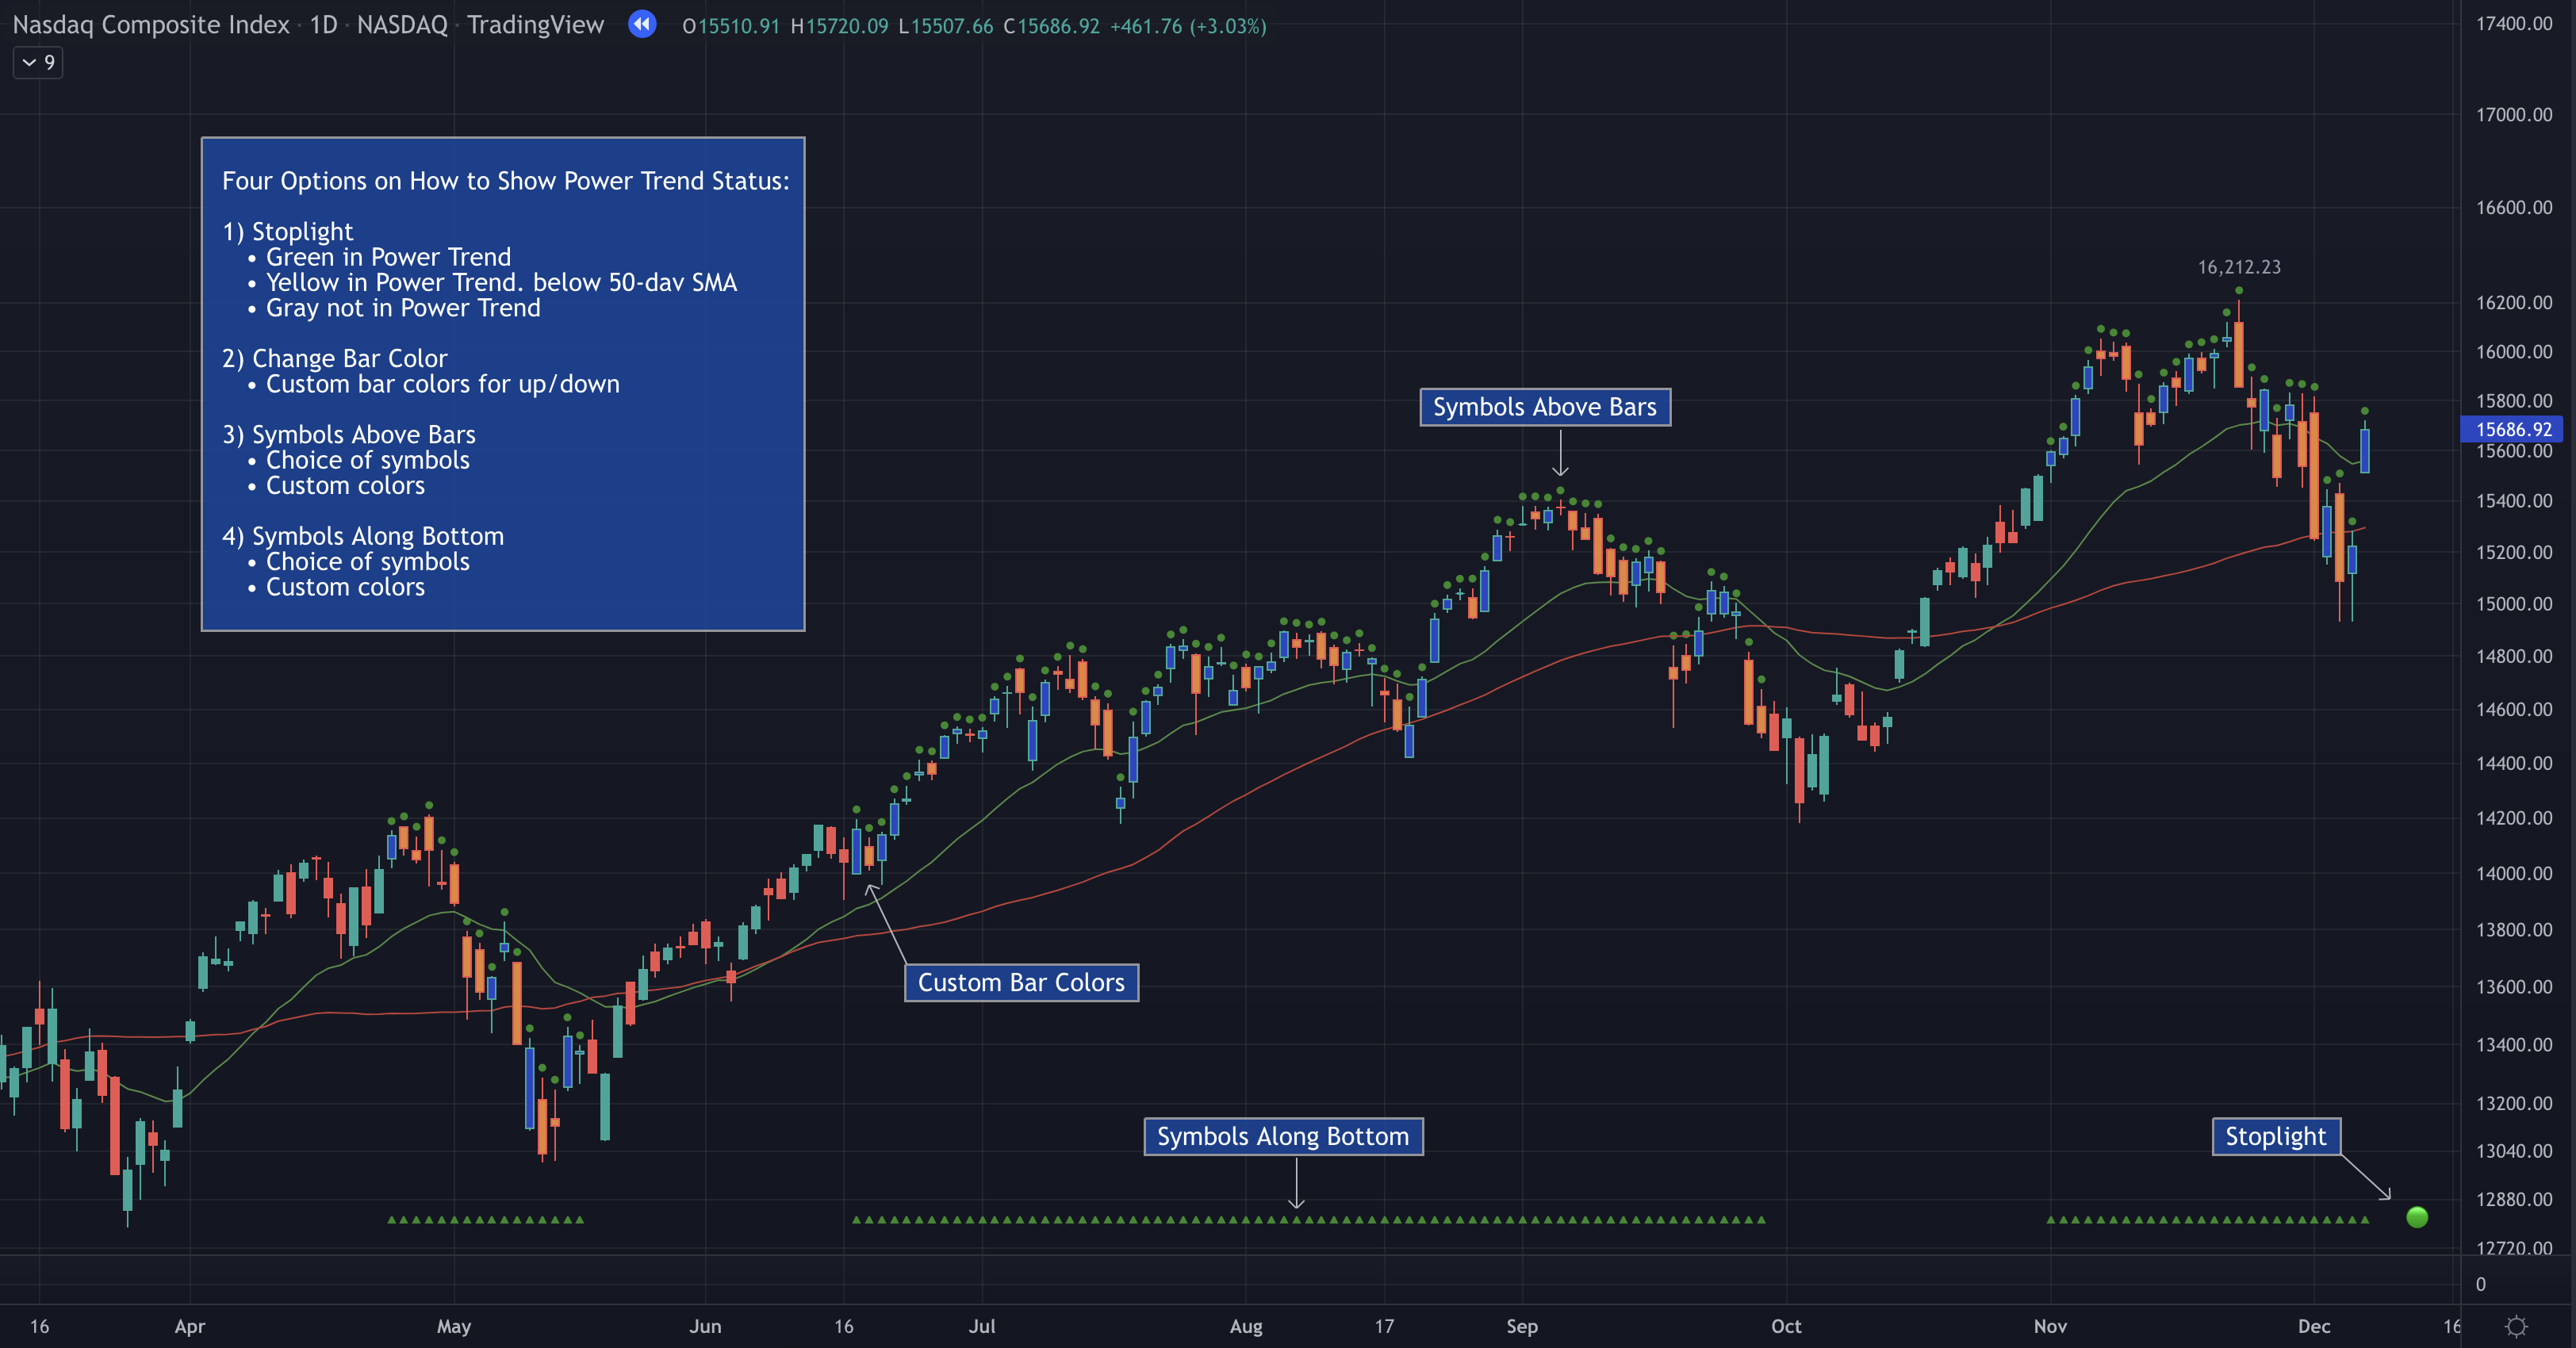
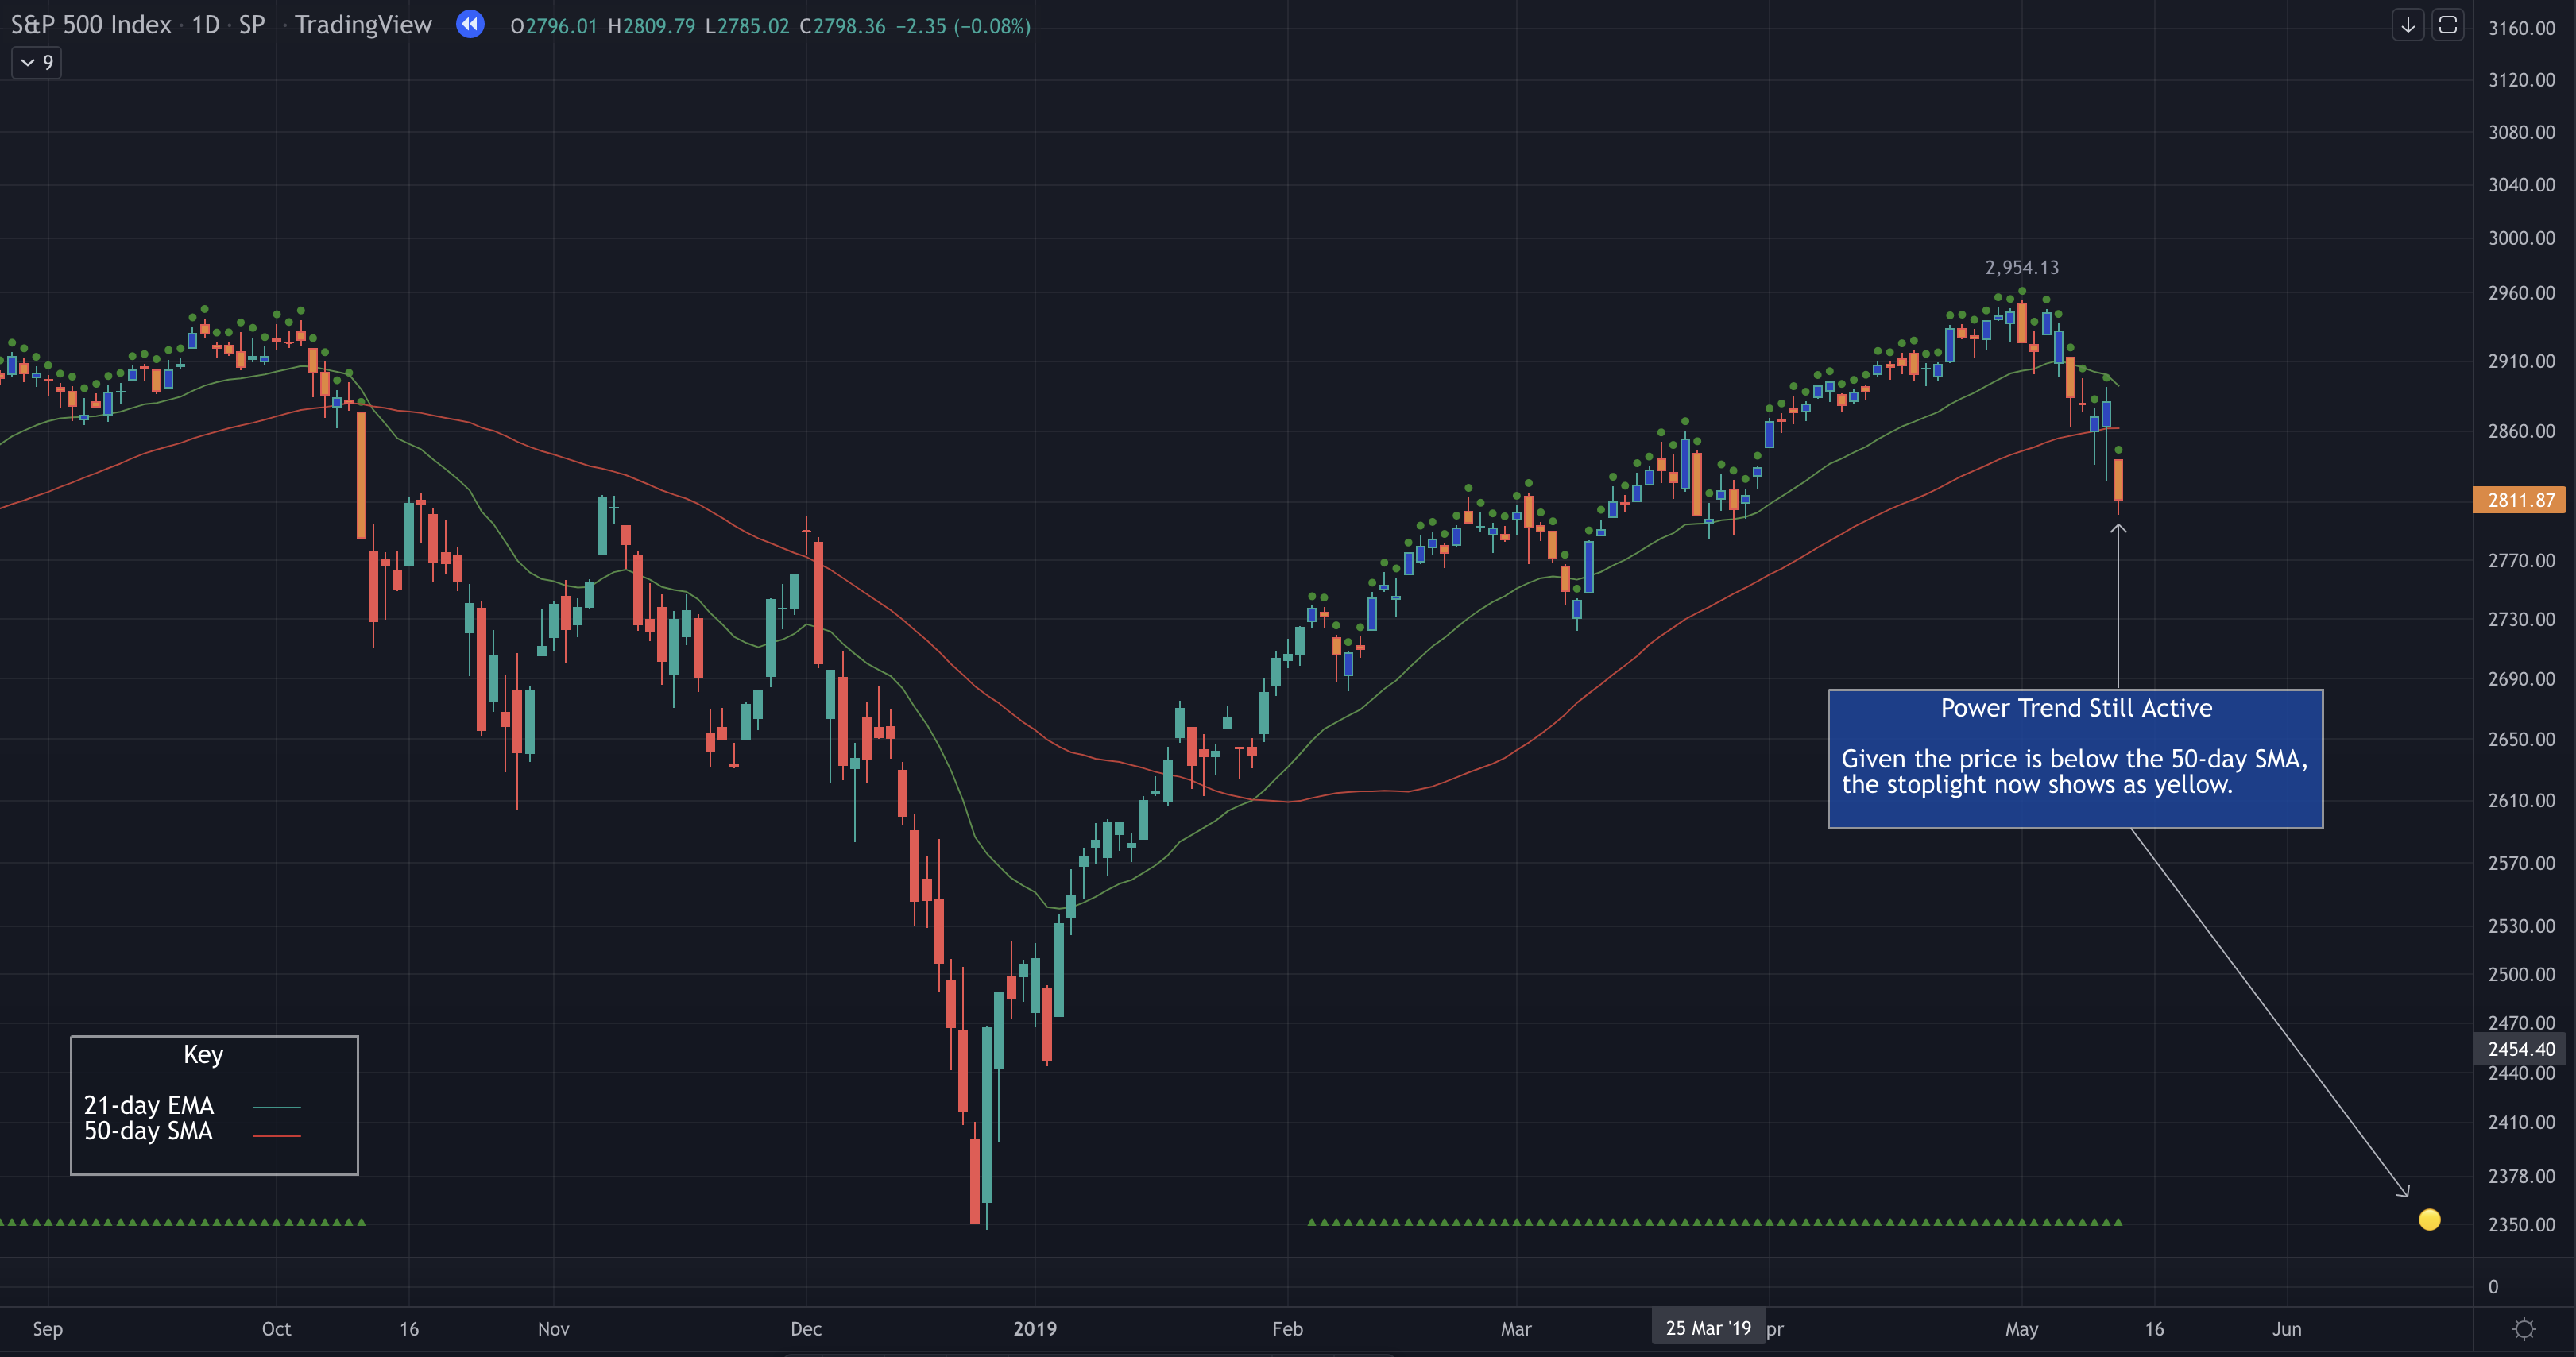
If you prefer to keep your charts clean, the stoplight option may be your best bet. This chart signal displays green, yellow or gray depending on the status of the Power Trend. For example, when the light is green, a Power Trend is on. Yellow signals the Power Trend is still in place, however, the price is below the 50-day SMA. Gray equates to Power Trend is off.
Additional Examples of Power Trends
The example below shows a Power Trend on the ARKK ETF.
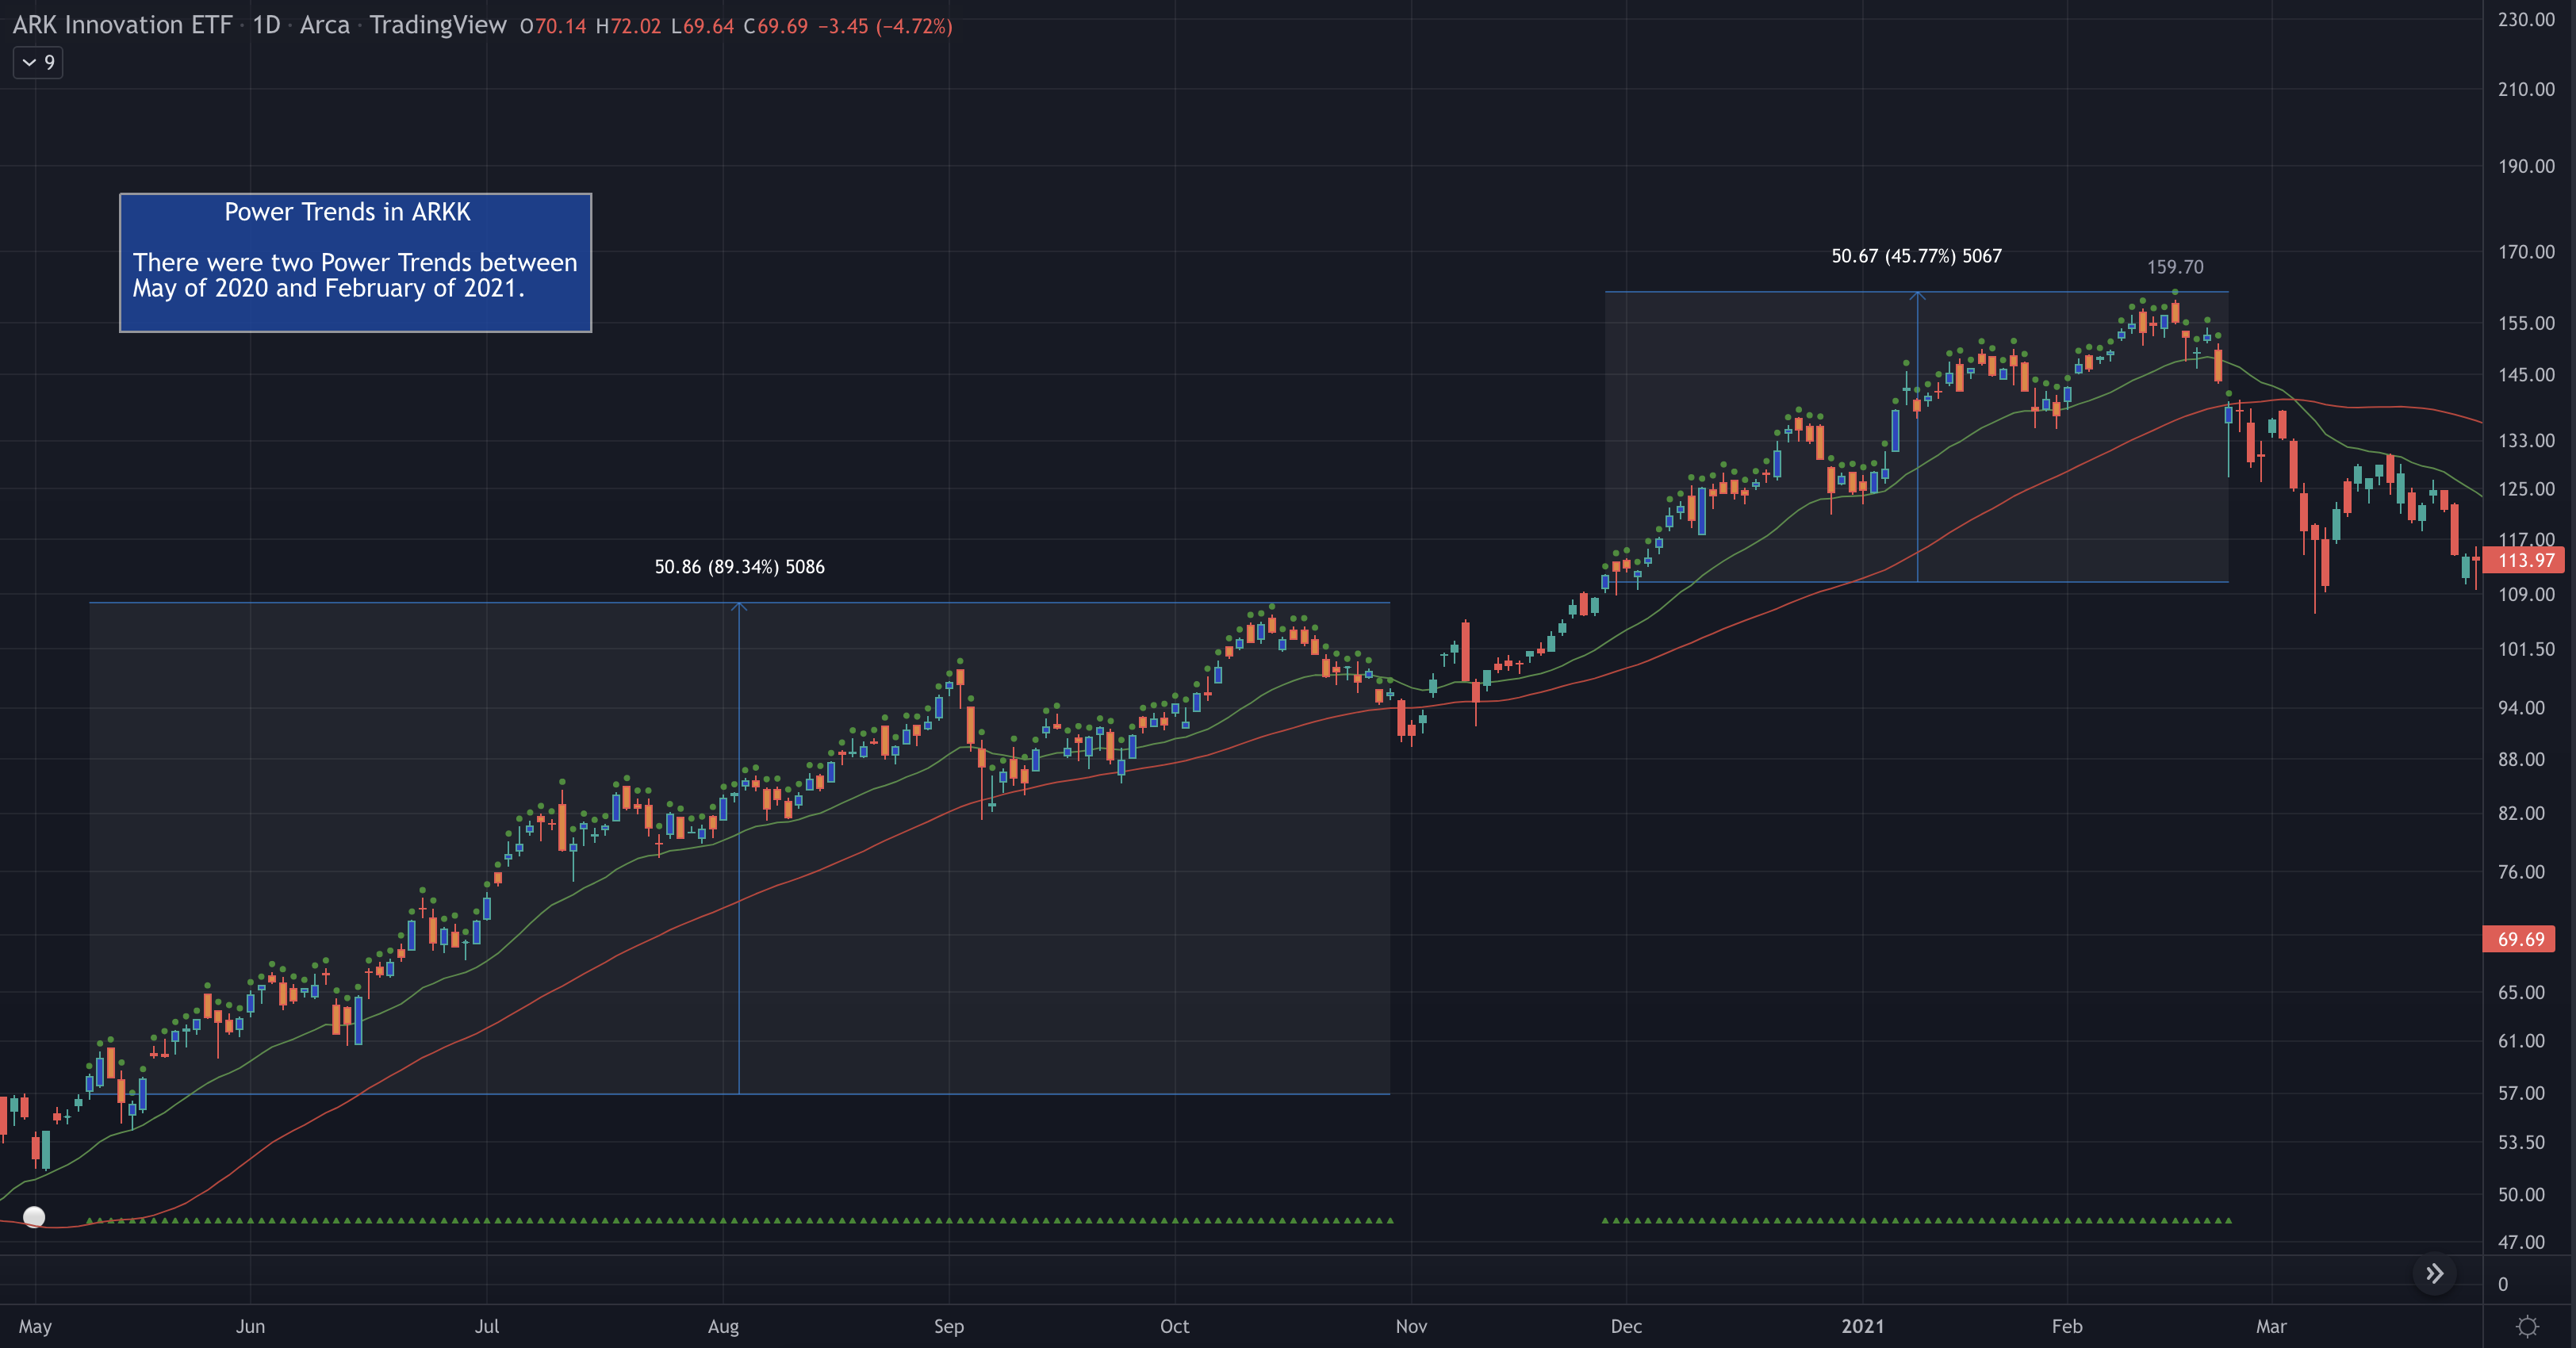
A Power Trend ends when the 21-day EMA crosses under the 50-day SMA.
There is a Power Trend “circuit-breaker” when the price breaks below the 50-day line and closes 10% or more from a recent high.
Alerts on Start and End of a Power Trend
In addition to the visual signals mentioned above, you can also set Alerts to be notified when a Power Trend starts or ends. This is one of the more unique and helpful features of this indicator.
For example, you can create an Alert on the Nasdaq Composite that will send a message whenever the requirements for a Power Trend are met. Given TradingView alerts are stored server-side, you can be on notified even if you are not currently running TradingView.
To set an Alert:
■ Make sure you are viewing an index or fund
■ Right-click on chart and select ‘Add alert’
■ From the Condition select ‘Power Trend’
■ Choose either ‘Power Trend Started’ or ‘Power Trend Ended’
■ Select ‘Once Per Bar Close’
Features
■ Four options to highlight where Power Trends starts and ends:
• Custom colored bars.
• Stoplight with configurable location.
• Custom symbol and color above bar.
• Custom symbol and color below bar.
■ Show recent high price, configurable font size and color.
■ Custom alerts on the start and/or end of a Power Trend.
Don’t Have a TradingView Account?
Register through this link to the Partner Program and you will get up to $30 to put towards your plan.
Disclaimer
This indicator is for informational and educational purposes only. Do your own research before making any trade decisions. We accept no liability for any loss or damage, including without limitation any loss of profit, which may arise directly or indirectly from use of or reliance on this indicator.