


A common question regarding MarketSmith: what is the difference between the RS Line and RS Rating?
I originally wrote a short post describing the differences (see below). The video tutorial that follows provides some additional insight as well as highlights several examples on how to use both indicators when scanning for growth stocks.
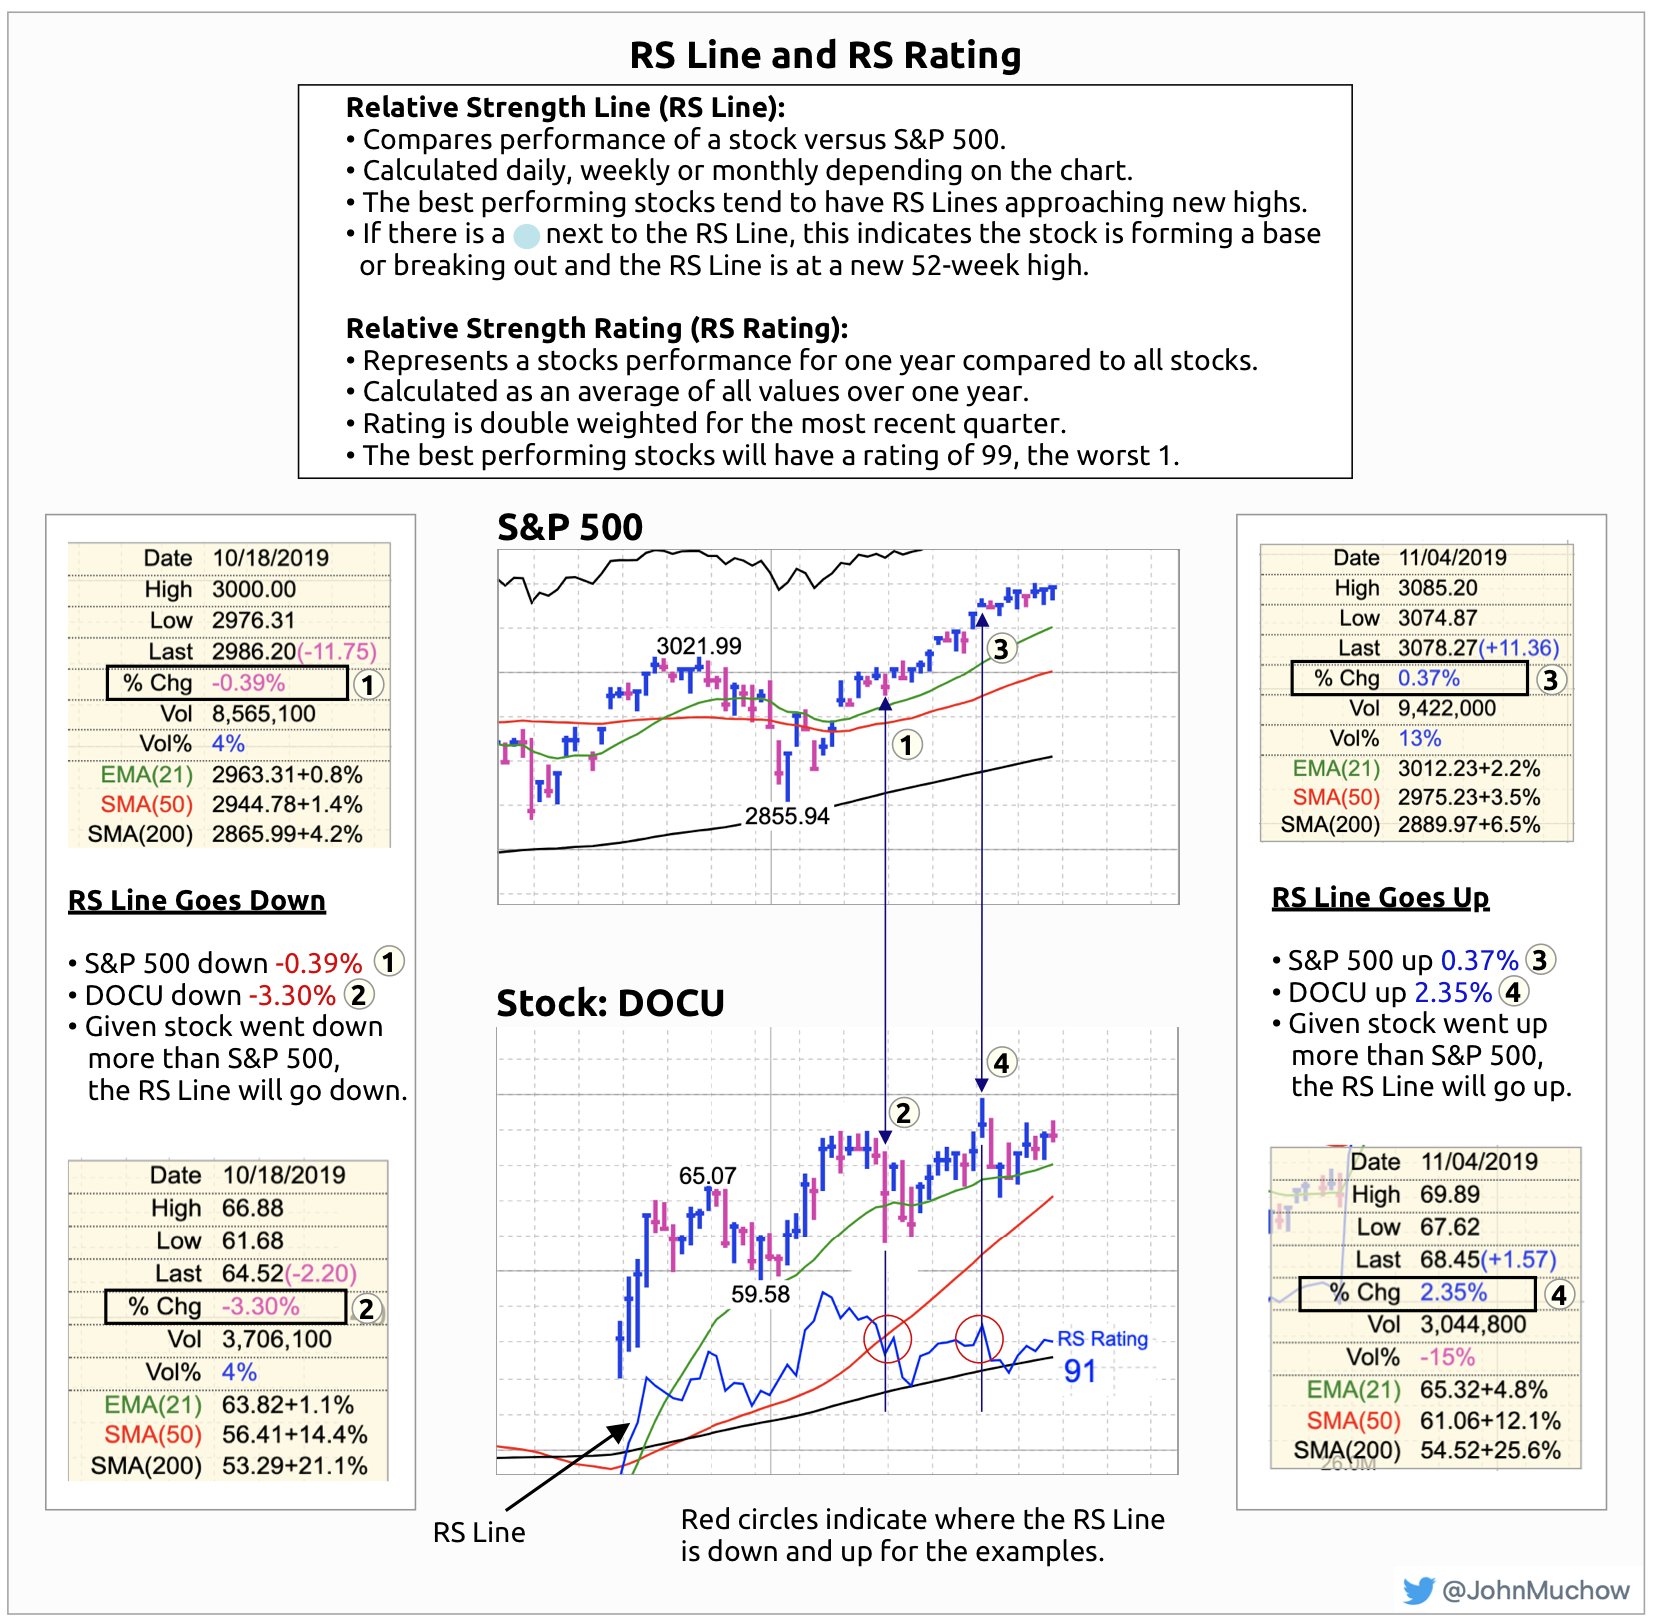
RS Line Movement Up/Down Based on S&P 500 Action
Below is a cheat sheet that shows more detail on how the RS Line moves up or down based on the action in the S&P 500.
Original Post on RS Line and RS Rating
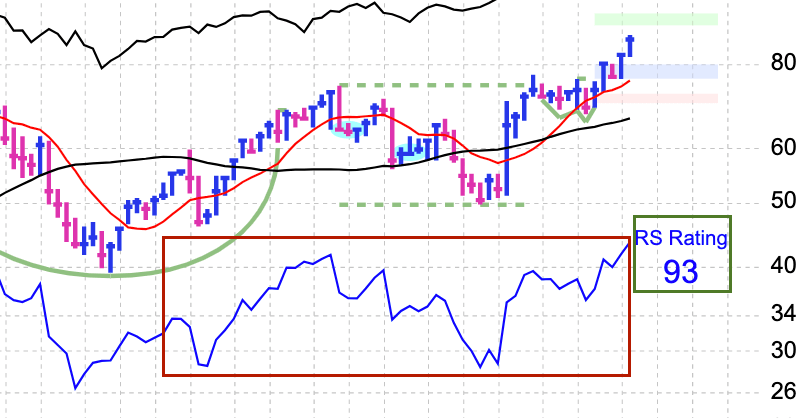
Although both values appear next to each other on a MarketSmith chart, the RS Line and RS Rating are quite different in what information they represent. To create a visual to indicate these values are unique, I’ve drawn a red box around the RS Line and a green box around the RS Rating.
RS Line
The RS Line represents a stock’s performance versus the S&P 500. If you are looking at a weekly chart, the RS Line is the performance of the stock over the past week versus the S&P 500 over that same time frame. The same logic applies to the daily and monthly charts, only the time frames are different.
If a stock moves up for the day/week/month and the S&P 500 does not, the RS Line will move up. If a stock ends the day/week/month flat, but the S&P 500 moves up, the RS Line will go down.
The daily chart can have a little more “noise” as it reflects price movements on a more frequent basis. Look to the weekly and monthly RS Line to get a view of the longer term trend.
RS Rating
This value represents a stocks performance for one year compared to all stocks in the database. The value is double weighted for the most recent quarter. The best performing stocks will be a 99 and the worst 1.
Keep in mind that the RS Rating is calculated as an average of all values over one year. Therefore, a gap up/down will have little impact on the RS Rating. Contrast that with the RS Line, which is calculated daily, weekly or monthly depending on the chart you are looking at.
3 Month and 6 Month RS Ratings
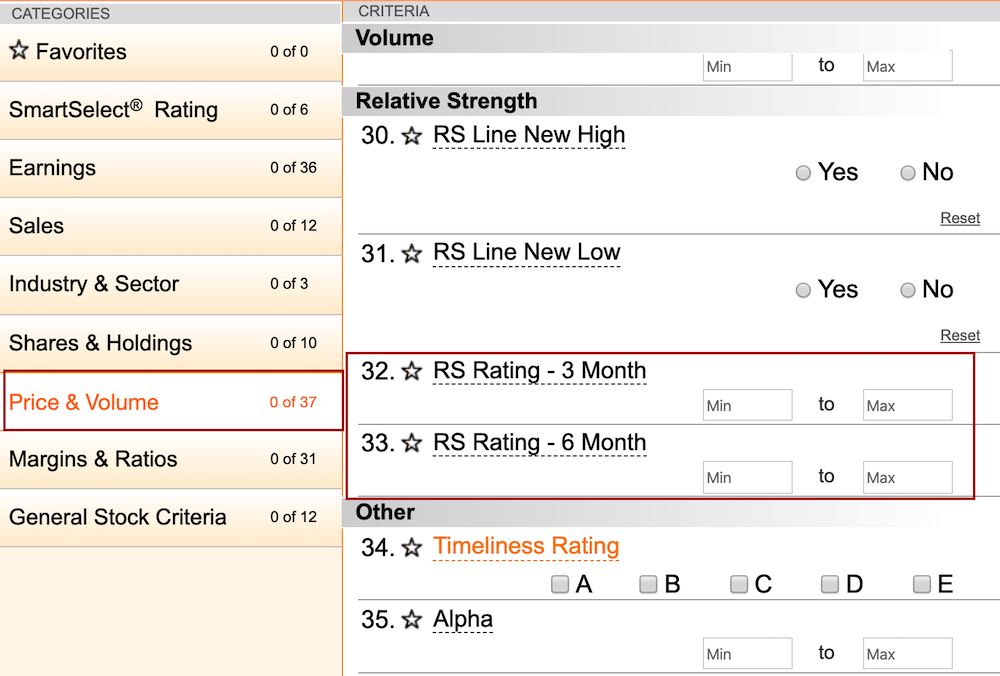
MarketsSmith has support for 3 and 6 month RS Ratings, both are exponential values, meaning there is more weight on recent days. The one caveat is that these values are not shown on the chart.
You can access 3 and 6 months ratings via the custom screen feature in MarketSmith. Choose the Price and Volume category and scroll down to the 3 and 6 month options.
Guidelines
RS Line
- RS Line at a glance shows if a stock is a leader or laggard
- If the S&P is heading down and RS Line is heading up, that is a sign of strength
- During a Bear market, often the best performers are those with strong RS Lines
RS Rating
- Given the RS Rating is based on a yearly average, it can be slow to change
- If a stock has a significant drop, it will take time for the value to come down
- Don’t use RS Rating as sell signal