


One sign of a potential true market leader is when there is a divergence of the stock’s price action versus the overall market. In this post I’ll show several examples where the S&P 500 was moving down while a stock was moving up, preceding a large gain over the coming months.
As with any technical or fundamental indicator, divergence is no guarantee of upward price movement. However, as you’ll see, divergence may be foretell a winning stock, one that can make a significant move higher.
Ebay
Notice the S&P 500 was heading down while Ebay was making a strong move up.
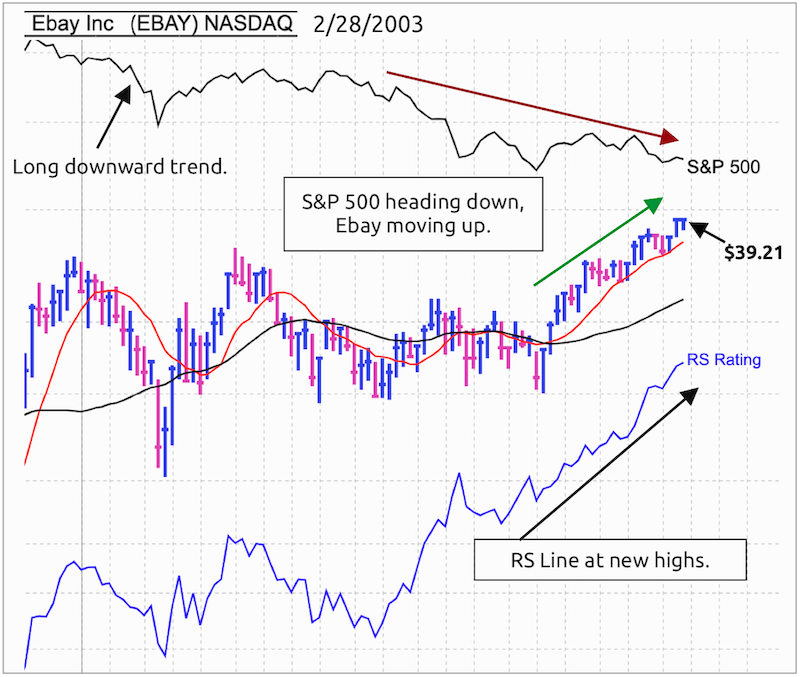
Ebay continued to move up for gain of 197% over 10 months.

OKTA
The chart for Okta is a little busy. Hopefully the gray shaded areas help to highlight the divergence between the S&P 500 making a sharp move down while at the same time Okta was making higher lows.
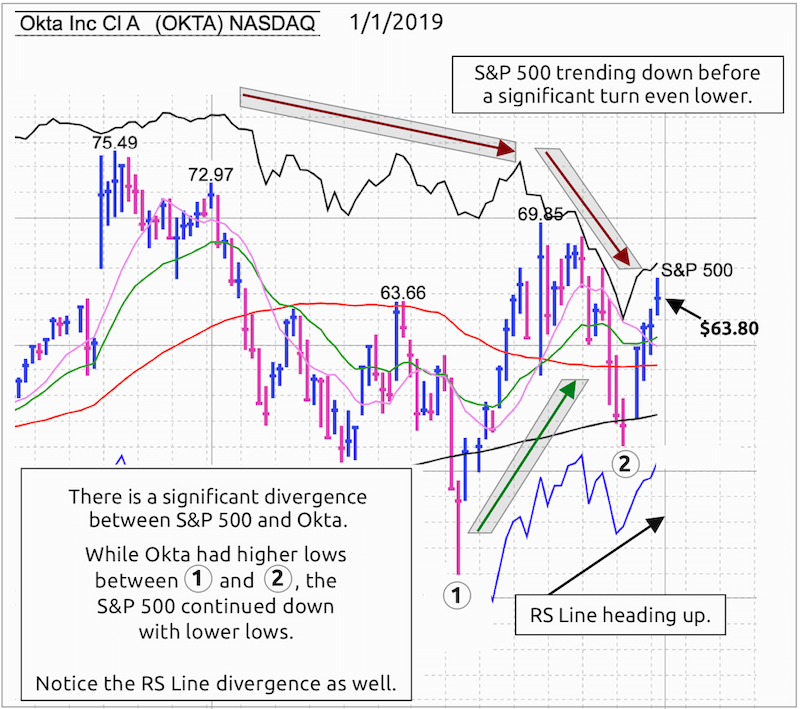
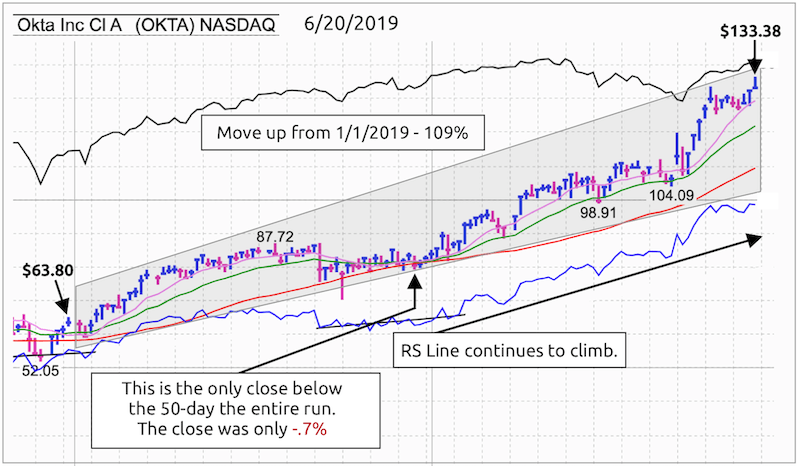
In only 5 months, Okta gained 109%.
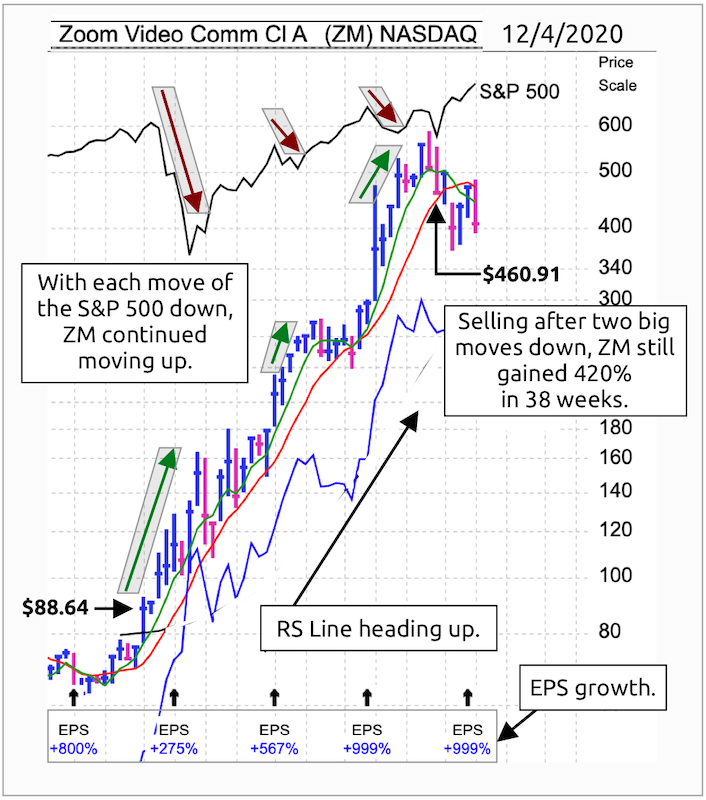
Zoom
The weekly chart of Zoom shows an impressive run up. Notice that there was only one close below the 10-week moving average in over 38 weeks.
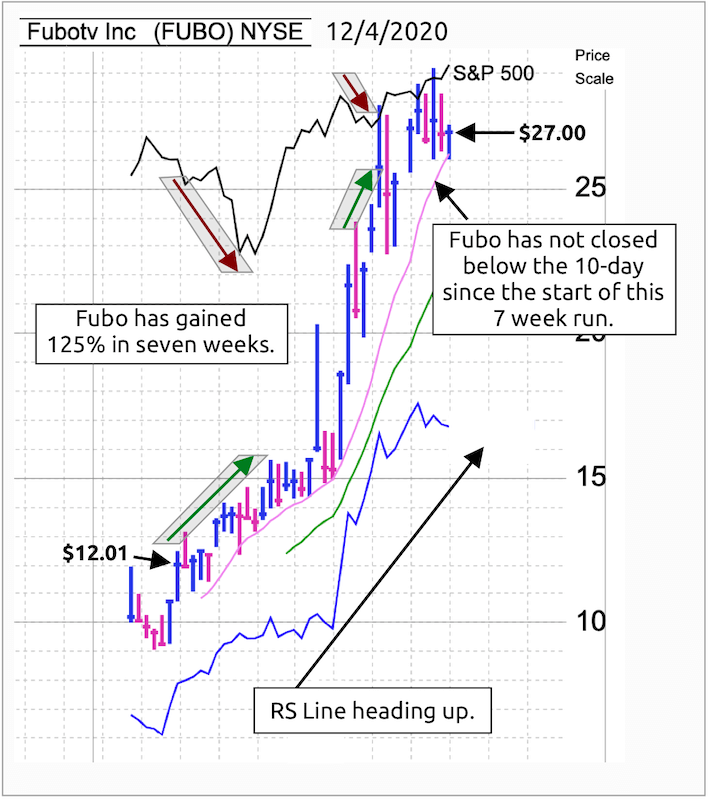
Fubo and IPO Divergence
Curious if this same line of thinking applies to IPOs? One look at Fubotv reveals the answer.