


The concept of tightening price action, lower highs and higher lows, along with volume declining, will often lead to a breakout that follows in the direction of the prior trend.
William Jiler in 1962 referred to this as a coil. Mark Minervini, in his book Trade Like a Stock Market Wizard, describes similar price action which he refers to as volatility contraction pattern (VCP). It is also known as a symmetrical triangle.
In this post I’ll show historical examples as well as recent breakouts and current setups. My focus here is on daily and weekly charts. With that said, take some time and look at various intraday charts, the same concepts apply.
Tightening Price Action and Declining Volume
I’ve been re-reading what I consider a classic book of chart patterns, How Chart Patterns Can Help You in the Stock Market, written by William Jiler, 1962. Here’s how Jiler describes what he refers to as a coil:
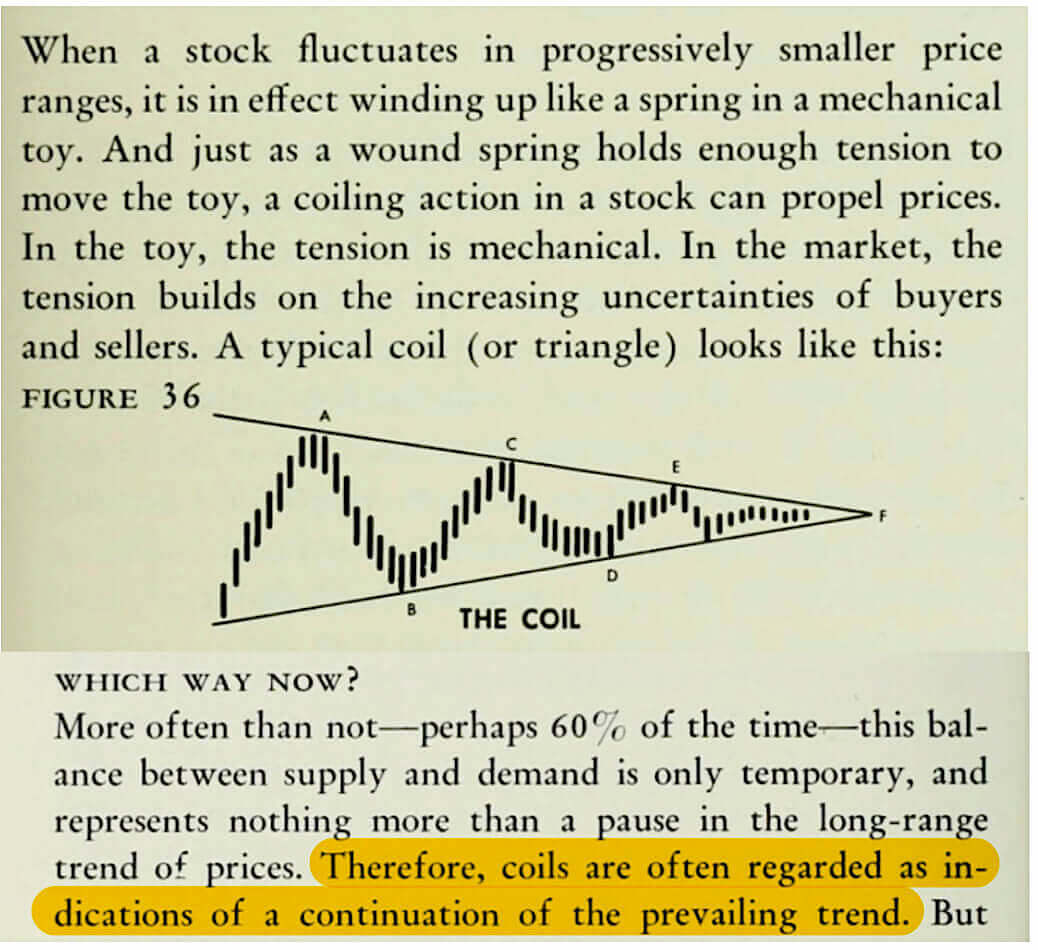
In my own study of stocks that look to be showing this pattern, close to 80% follow the prior trend if there is a breakout.
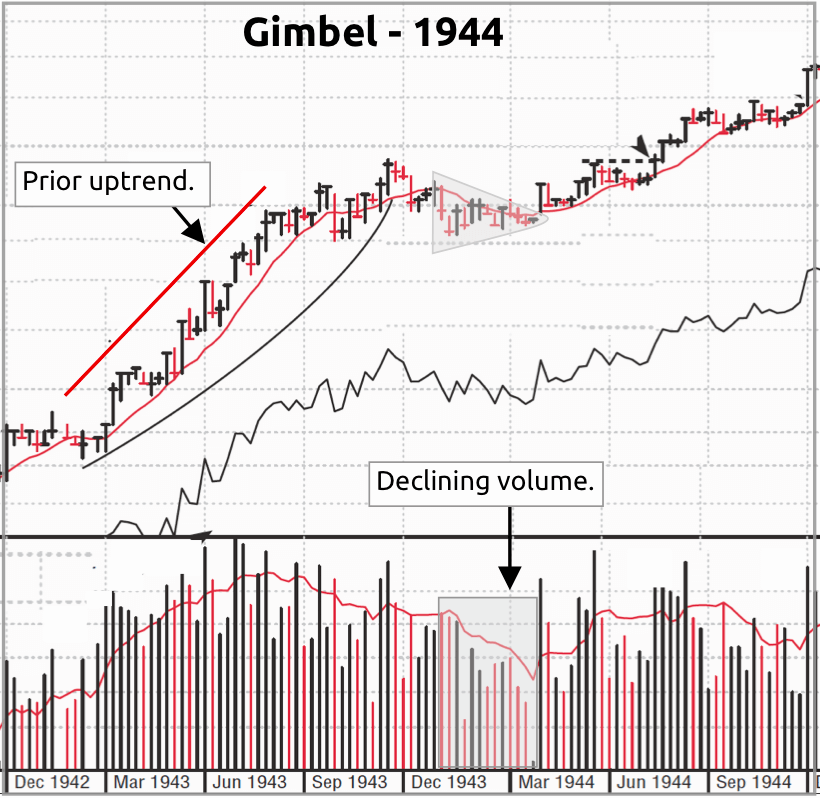
Historical Charts
It’s always interesting to look at historical charts. The more charts you view, the more obvious it becomes that nothing has changed with supply/demand and human psychology. Here’s a chart from 1944:
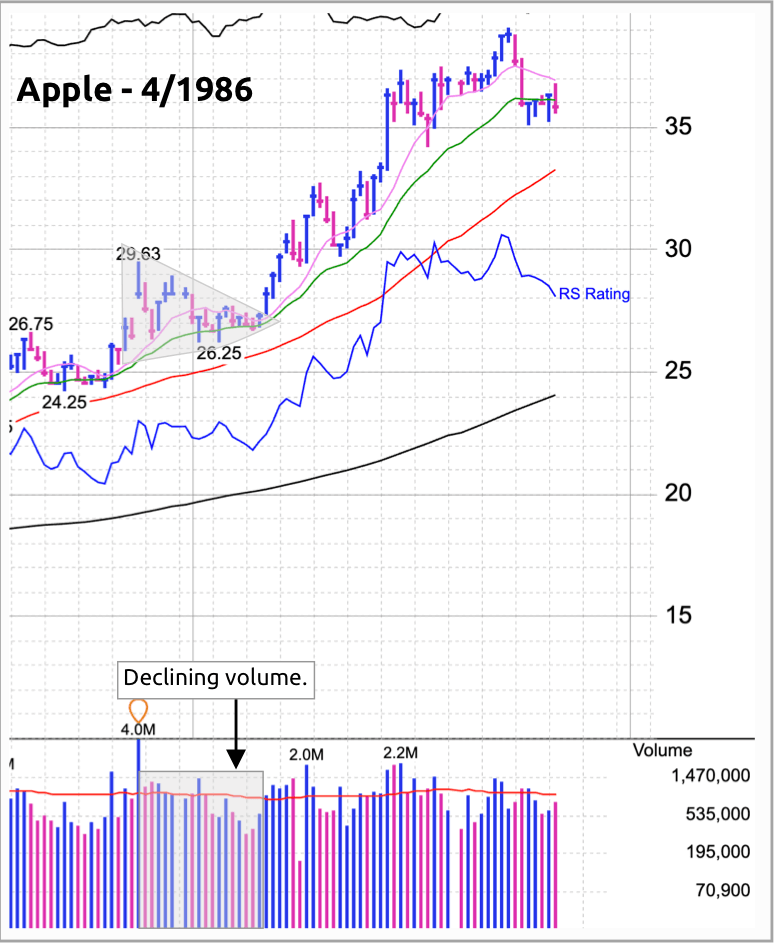
Apple (AAPL) has shown this consolidation pattern many times over the years. Here’s a chart from 1986:
Tightening Action and Recent Breakouts
Let’s look at two examples of recent tightening action, followed by breakouts. Following are charts for Zoom (ZM), both daily and weekly.
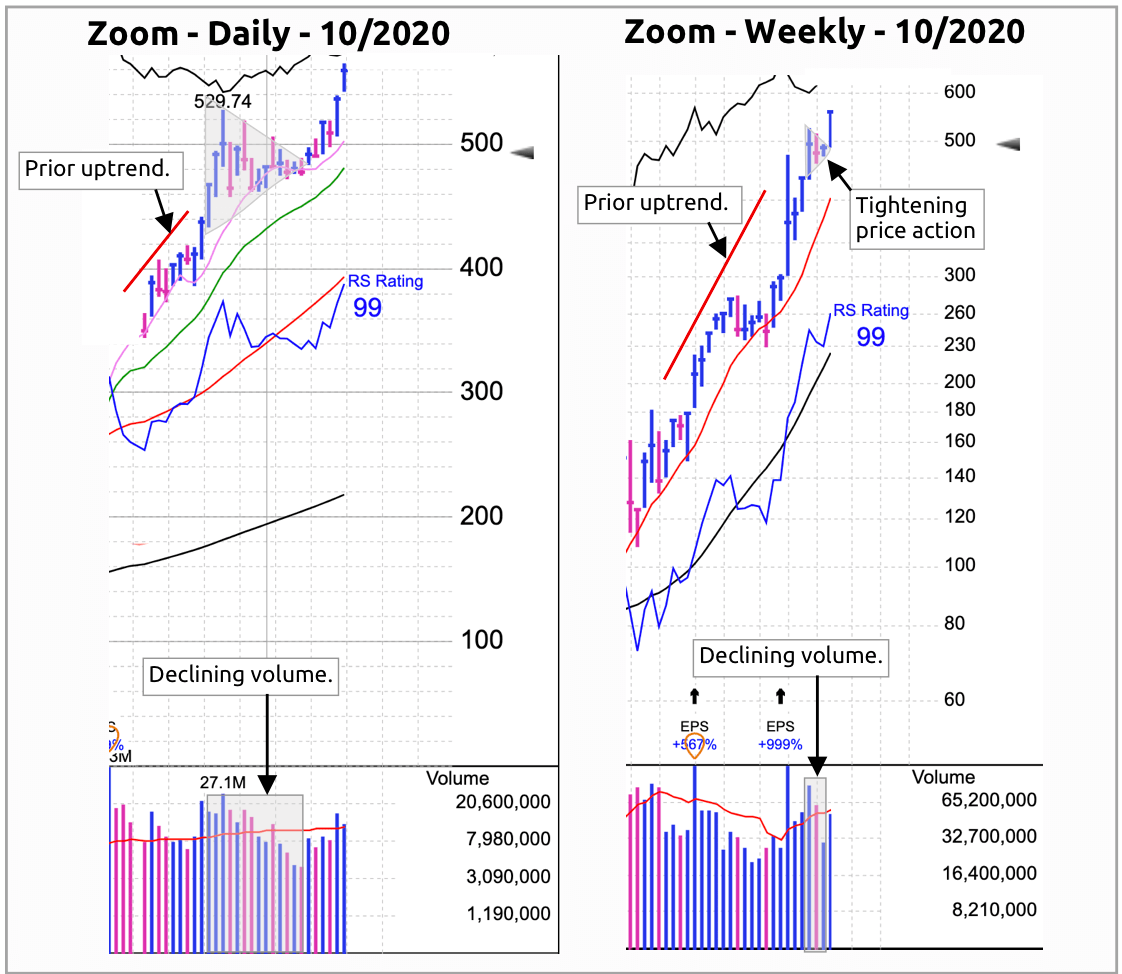
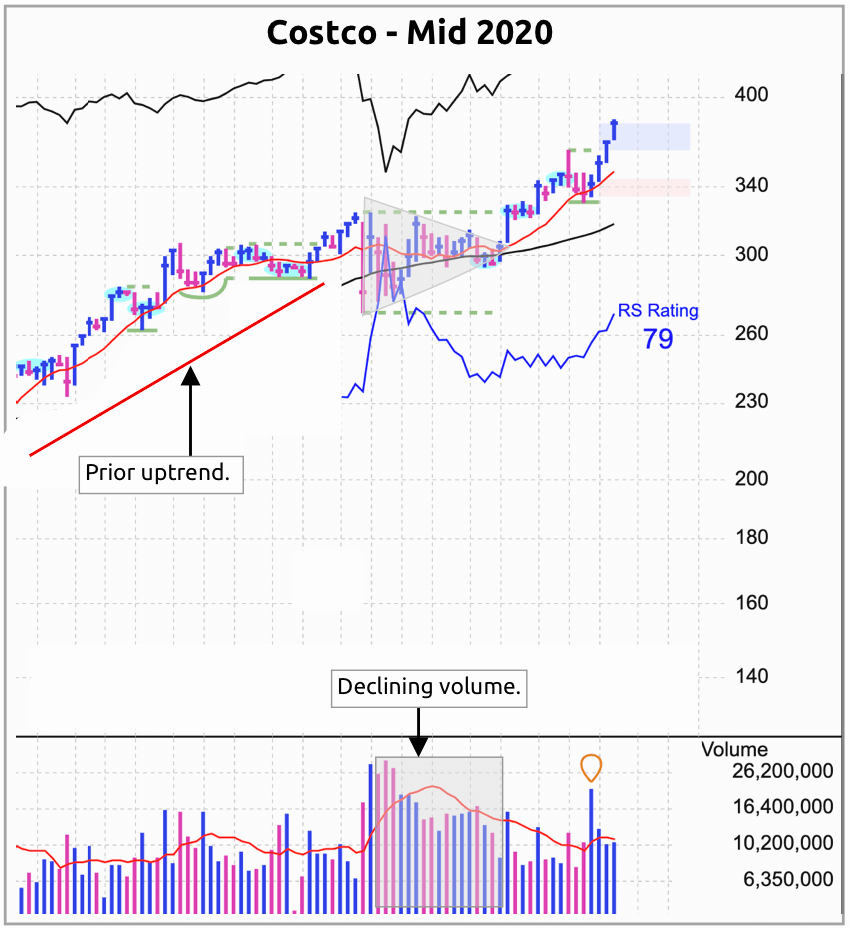
As the price is contracting, notice that the volume is also declining. Upon breakout, the price action continued in the direction of the prior trend. Notice the same action for Costco (COST):
Current Setups
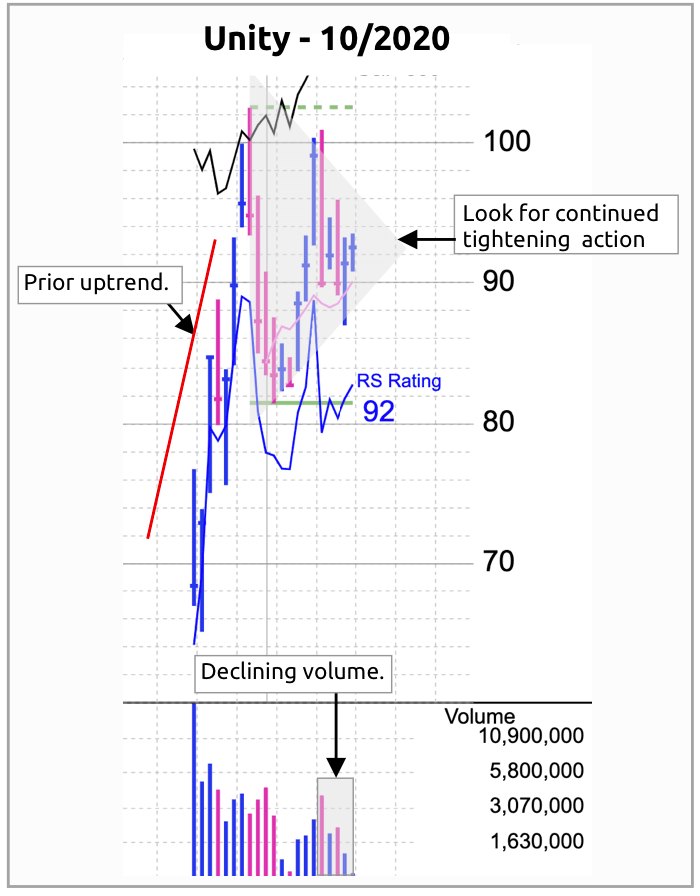
Finally, here are two charts of current setups, as of 10/17/20. Here’s the IPO base of Unity Software (U):
The daily and weekly charts of TSLA show consistent price tightening and declining volume.
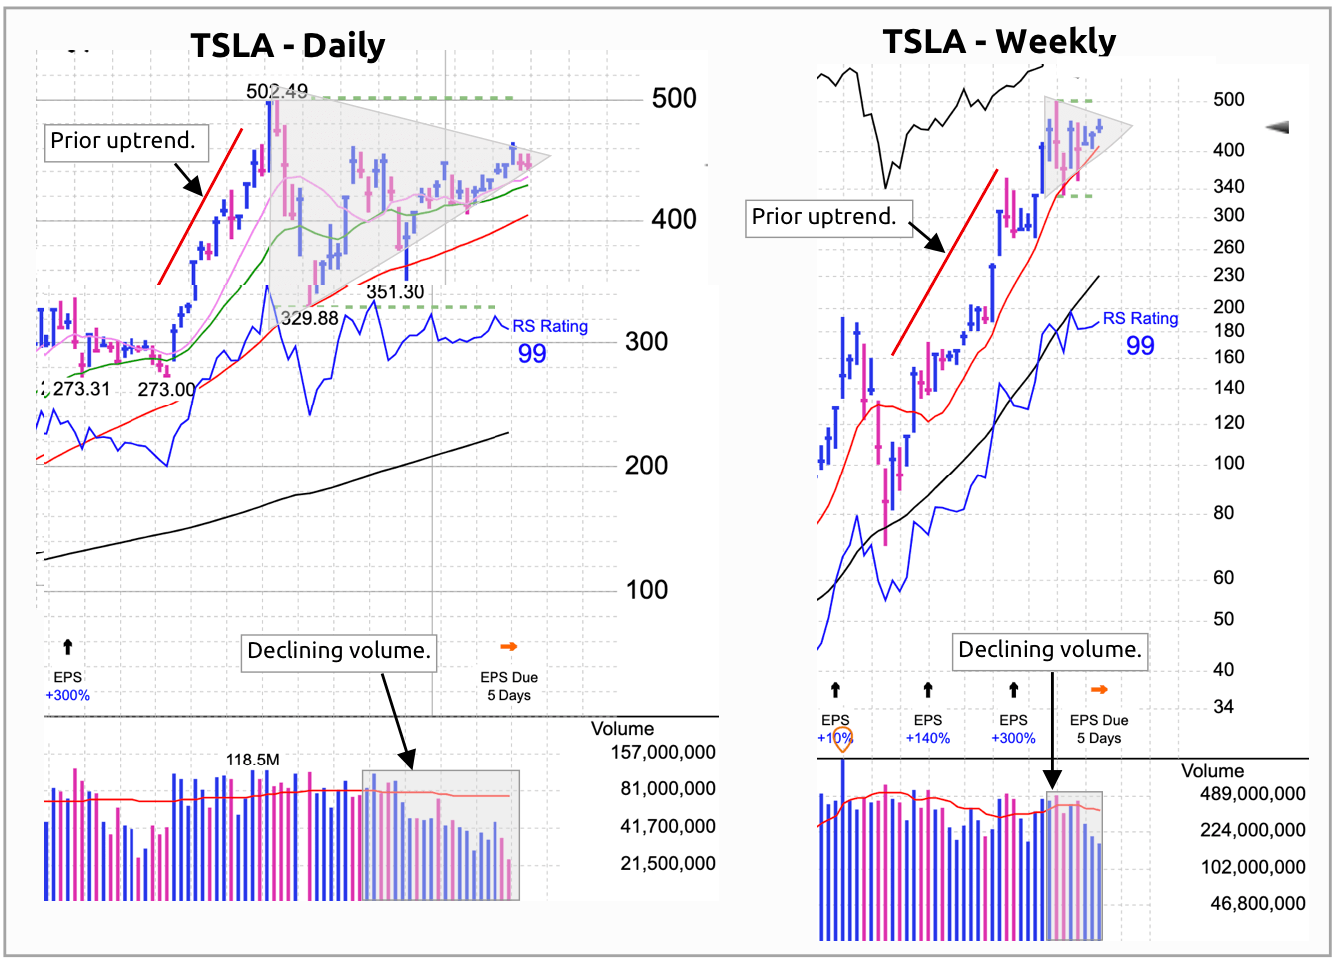
In the coming days/weeks look for a breakout. Chances are, the prior upward trend will continue.
Summary
As with all technical patterns, this is an art, not science. With that said, tightening price action with a decline in volume may foretell a continuation of the prior trend. It’s worth some time to study and look for this pattern.
Join the Discussion on Twitter:
Tightening price action with a decline in volume, often proceeds a breakout and move in the direction of the prior trend. Jiler in 1962 called this a coil, @markminervini refers to similar price action as volatility price contraction (VCP).https://t.co/MfeJLEz02q
— John Muchow (@JohnMuchow) October 17, 2020