


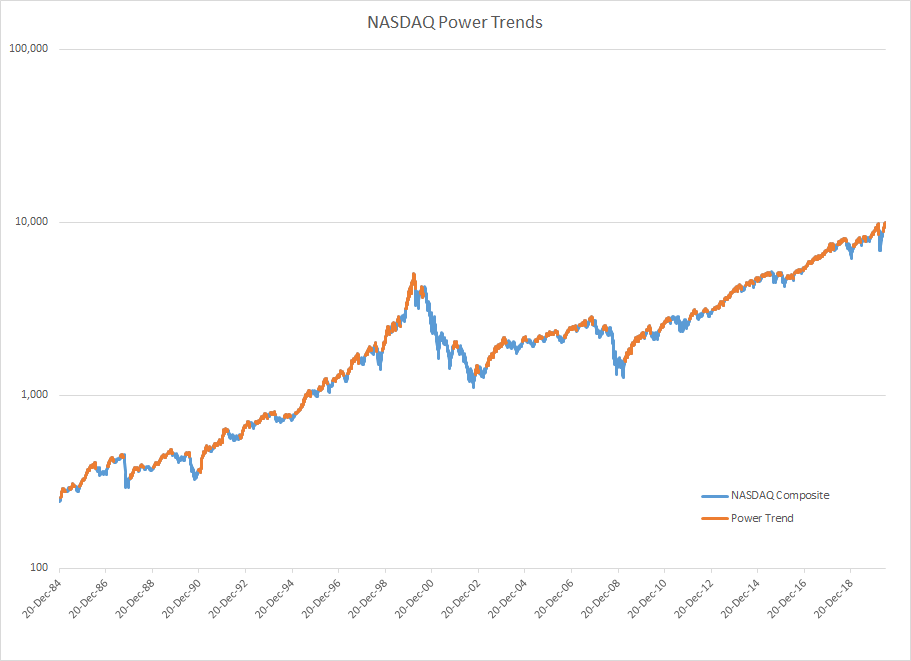
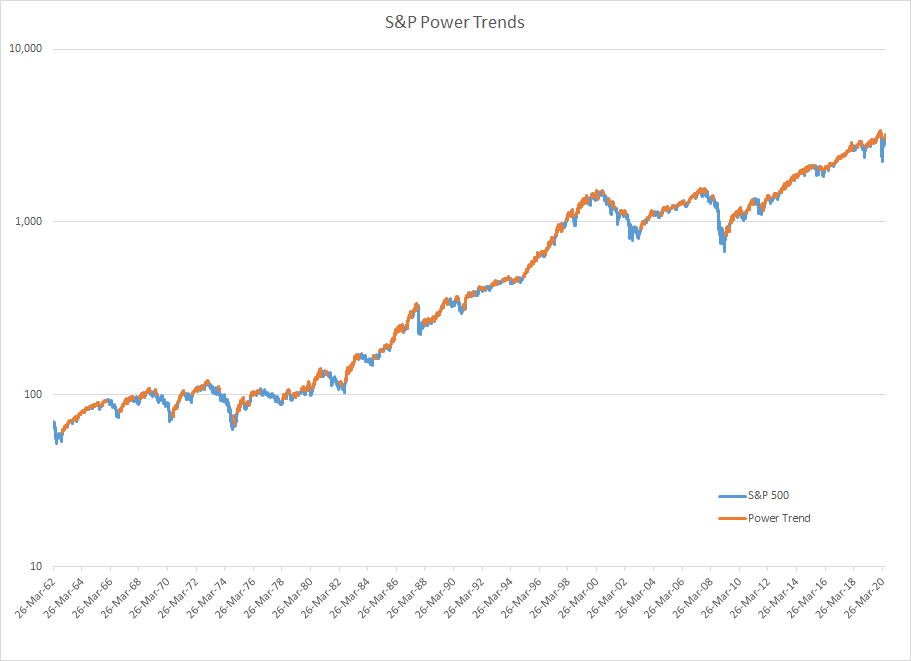
Mike Webster and Irusha Peiris recently discussed power trends on the Investing with IBD Podcast. Ajay Jani took the time to code the concept in an Excel document which shows power trends for both the Nasdaq and S&P.
The orange indicator in the charts that follow, highlights where the power trend is on. The Nasdaq chart goes back to 1984 and the S&P 500 back to 1962. Richard Moglen helped Ajay with data acquisition.
The Excel document created by Ajay can be downloaded here: PowerTrends.zip