


Webby’s RSI (really simple indicator) is a technical indicator to gauge the health of an uptrend. The concept of Webby’s RSI and the original implementation was created by Mike Webster. In this post I’ll share a Pine Script version of Webby’s RSI that you can use on TradingView.
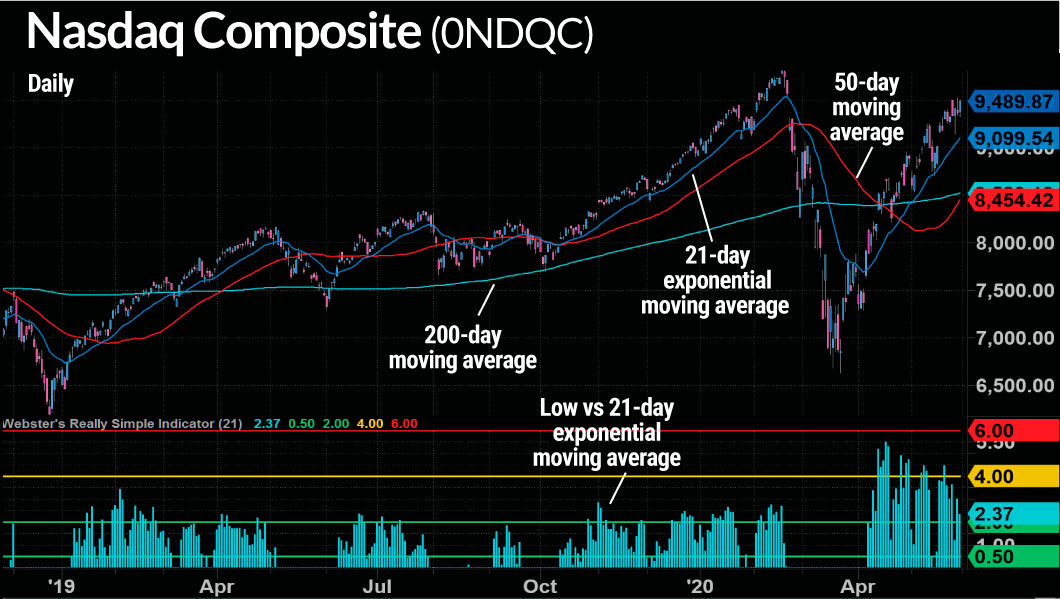
Webby’s RSI, most often used with the Nasdaq Composite, is the percentage of the low vs. the 21-day moving average. At the beginning of a bull market, the higher the value, the better.
If you are familiar with TradingView and would like to install the indicator, you can find Webby’s RSI here.
Before we get into the code, here’s how Webby’s RSI looks as originally developed by Mike:
Webby’s RSI in TradingView - Four Plot Types Available
The default plot option I created for Webby’s RSI is a histogram, this is the closest representation to the original Webby’s RSI. The ideal range of 0.5% and 2.0% is shown with the green lines on the indicator. The fuchsia line is the 10-day moving average of Webby’s RSI.
The additional options I’ve added include column, line and area. Each are shown below.
Webby’s RSI - Live in TradingView
You can find Webby’s RSI, and the Pine Script code, on my PlayTheTrade profile in the scripts area of TradingView.
The chart below is a live view of Webby’s RSI in TradingView.