


Following are three charts that you can use as a visual reference for @mwebster1971‘s Weekend Stock Market Update for the week of 5/18/2020.
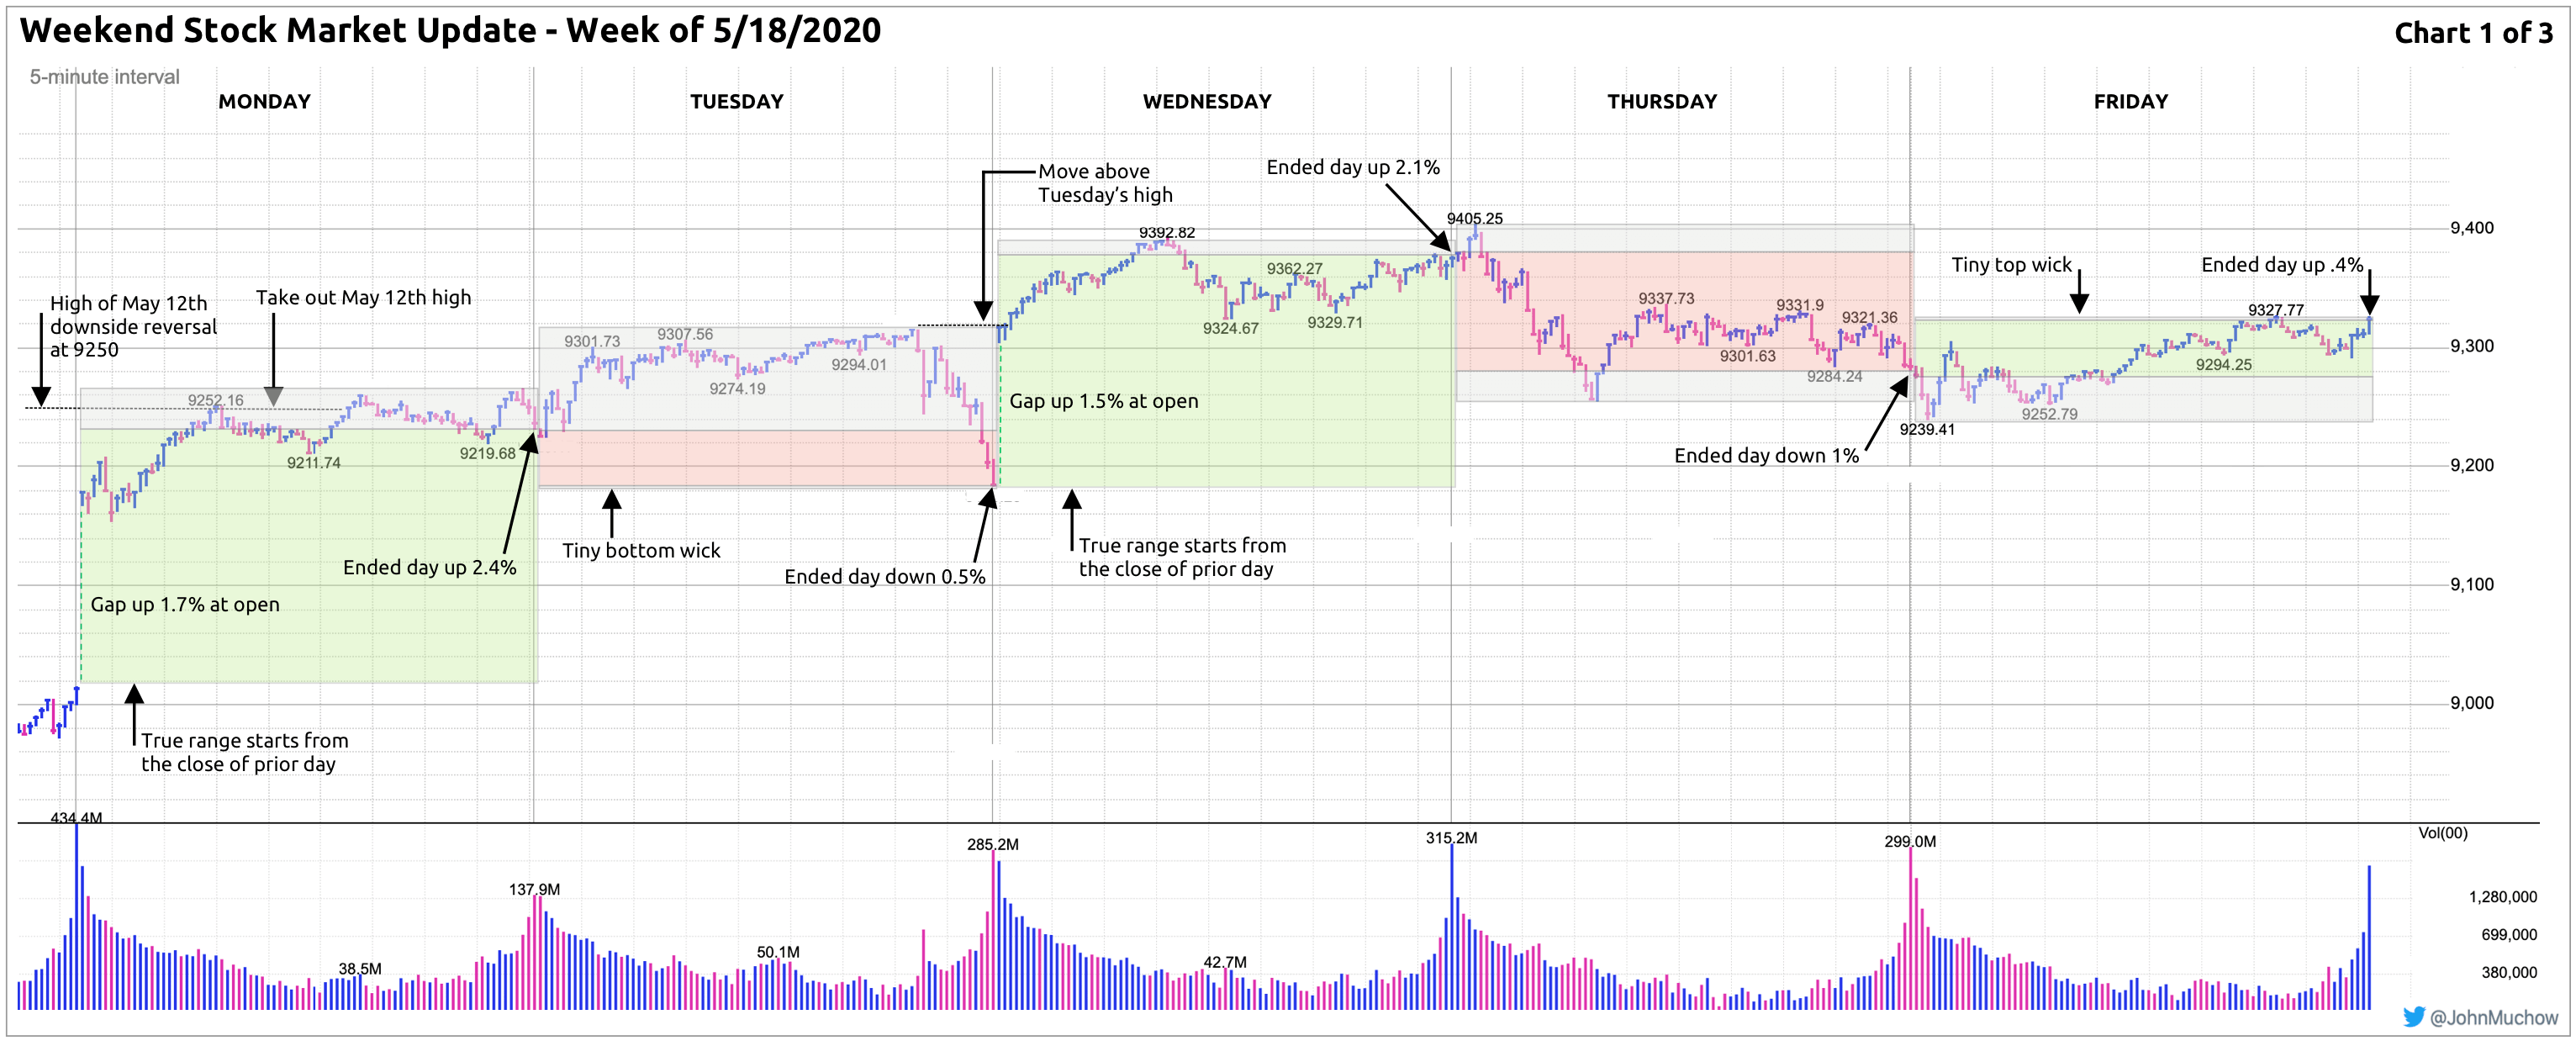
The first chart shows the 30,000 foot view of the week’s activity. I’ve highlighted the chart with colors to emulate a candlestick look on top of a 5-minute chart.
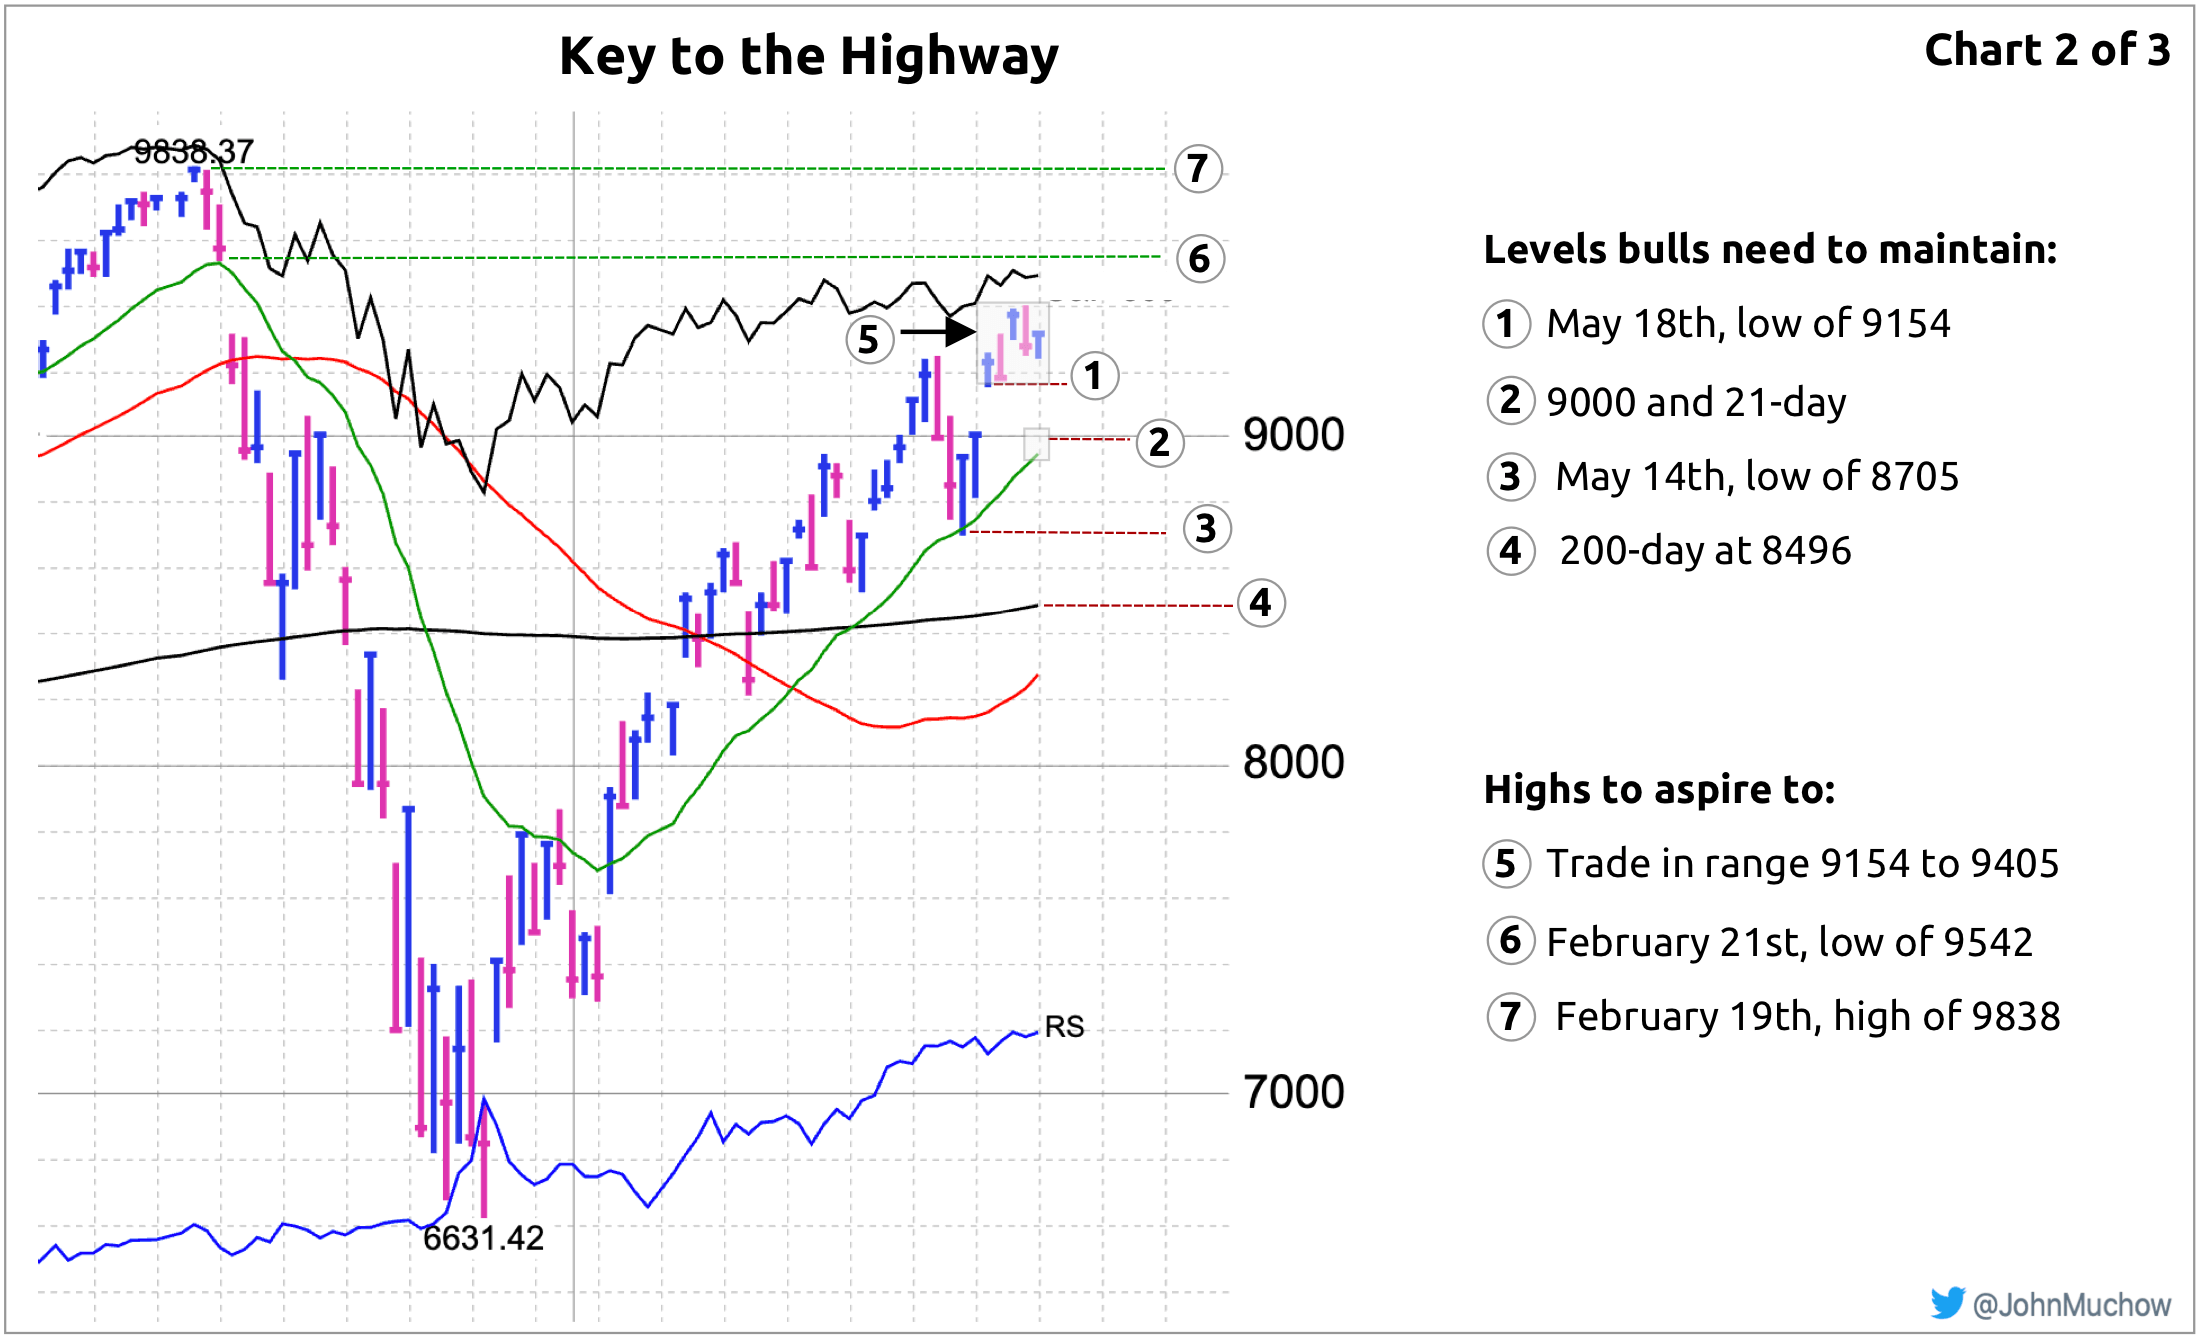
Next, here’s a look at the bullish levels to maintain, as well as new highs to aspire to.
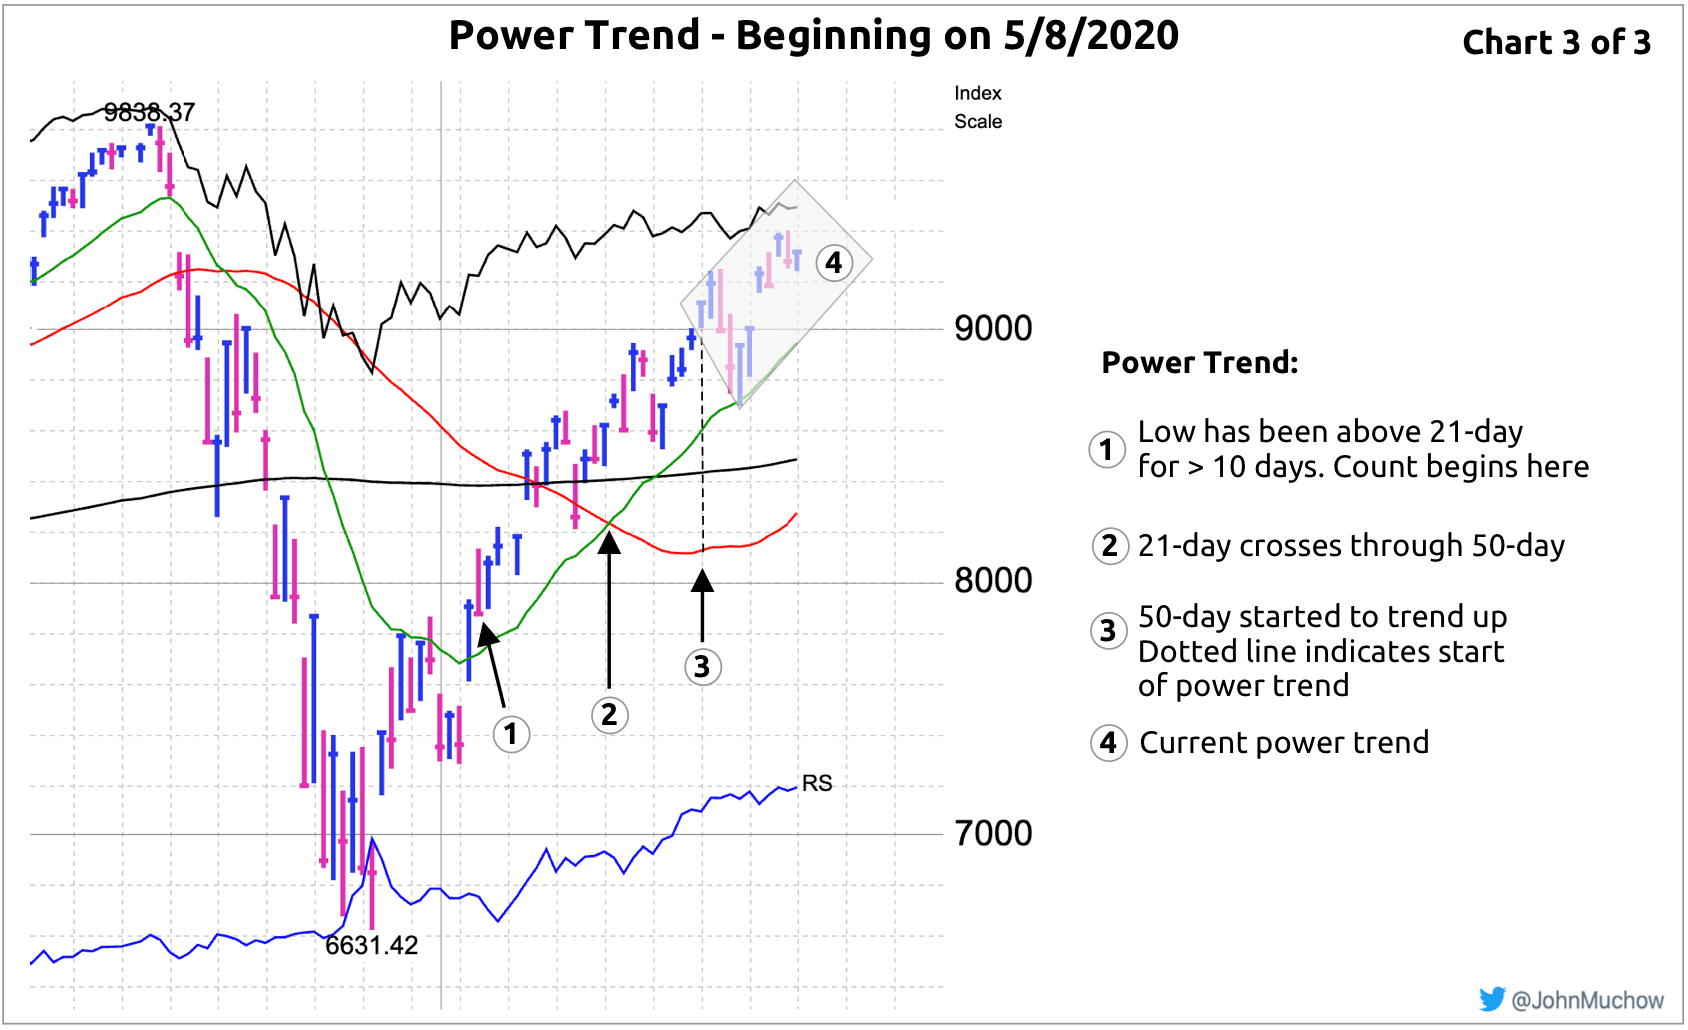
The final chart shows the Power Trend and how we got here.